OPEN-SOURCE SCRIPT
Chervolinos Ultrafast RMTA MACD
Description of a classic MACD:
MACD, short for moving average convergence/divergence, is a trading indicator used in technical analysis of stock prices, created by Gerald Appel in the late 1970s. It is designed to reveal changes in the strength, direction, momentum, and duration of a trend in a stock's price. The MACD indicator (or "oscillator") is a collection of three time series calculated from historical price data, most often the closing price. These three series are: the MACD series proper, the "signal" or "average" series, and the "divergence" series which is the difference between the two. The MACD series is the difference between a "fast" (short period) exponential moving average (EMA), and a "slow" (longer period) EMA of the price series. The average series is an EMA of the MACD series itself. The MACD indicator thus depends on three time parameters, namely the time constants of the three EMAs. The notation "MACD" usually denotes the indicator where the MACD series is the difference of EMAs with characteristic times a and b, and the average series is an EMA of the MACD series with characteristic time c. These parameters are usually measured in days. The most commonly used values are 12, 26, and 9 days, that is, MACD. As true with most of the technical indicators, MACD also finds its period settings from the old days when technical analysis used to be mainly based on the daily charts. The reason was the lack of the modern trading platforms which show the changing prices every moment. As the working week used to be 6-days, the period settings of represent 2 weeks, 1 month and one and a half week. Now when the trading weeks have only 5 days, possibilities of changing the period settings cannot be overruled. However, it is always better to stick to the period settings which are used by the majority of traders as the buying and selling decisions based on the standard settings further push the prices in that direction.
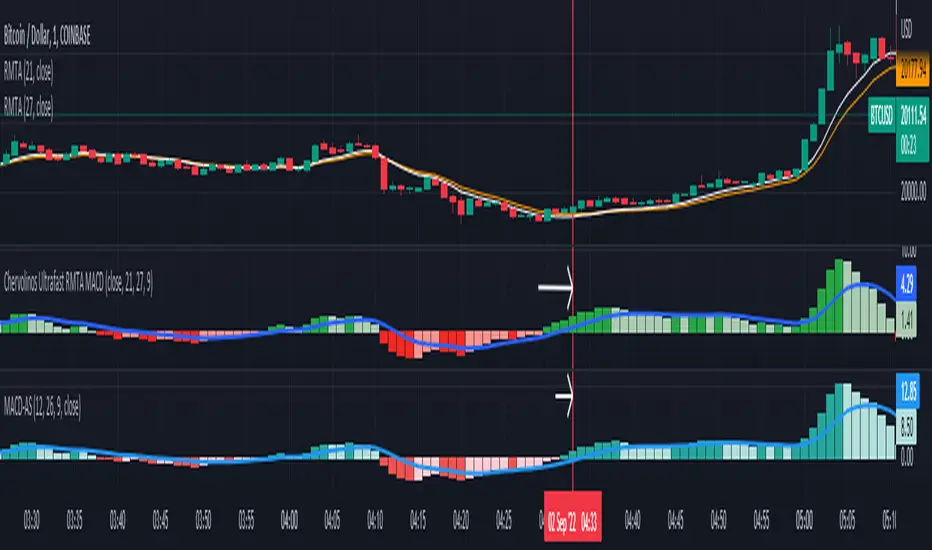
Description of the new Ultrafast RMTA MACD:
Ultrafast RMTA MACD, short for moving average convergence/divergence, is a trading indicator used in technical analysis of stock prices, created by Chervolino. It is designed to reveal changes in the strength,
direction, momentum, and duration of a trend in a stock's price. The RMTA MACD indicator (or "oscillator") is a collection of three time series calculated from historical price data, from the closing price.
The RMTA MACD based on the THE RECURSIVE MOVING TRENDLINE SYSTEM technical.traders.com/archive/articlefinal.asp?file=\V16\C12\091YEN.pdf
and is series is the difference between a "fast" (short period) Recursive Moving Trend Average, and a "slow" (longer period) Recursive Moving Trend Average of the price series. The average series is an EMA of the MACD series itself.
The result is a non laging indicator, depends on the settings.
special thanks to
everget
LonesomeTheBlue
MACD, short for moving average convergence/divergence, is a trading indicator used in technical analysis of stock prices, created by Gerald Appel in the late 1970s. It is designed to reveal changes in the strength, direction, momentum, and duration of a trend in a stock's price. The MACD indicator (or "oscillator") is a collection of three time series calculated from historical price data, most often the closing price. These three series are: the MACD series proper, the "signal" or "average" series, and the "divergence" series which is the difference between the two. The MACD series is the difference between a "fast" (short period) exponential moving average (EMA), and a "slow" (longer period) EMA of the price series. The average series is an EMA of the MACD series itself. The MACD indicator thus depends on three time parameters, namely the time constants of the three EMAs. The notation "MACD" usually denotes the indicator where the MACD series is the difference of EMAs with characteristic times a and b, and the average series is an EMA of the MACD series with characteristic time c. These parameters are usually measured in days. The most commonly used values are 12, 26, and 9 days, that is, MACD. As true with most of the technical indicators, MACD also finds its period settings from the old days when technical analysis used to be mainly based on the daily charts. The reason was the lack of the modern trading platforms which show the changing prices every moment. As the working week used to be 6-days, the period settings of represent 2 weeks, 1 month and one and a half week. Now when the trading weeks have only 5 days, possibilities of changing the period settings cannot be overruled. However, it is always better to stick to the period settings which are used by the majority of traders as the buying and selling decisions based on the standard settings further push the prices in that direction.
Description of the new Ultrafast RMTA MACD:
Ultrafast RMTA MACD, short for moving average convergence/divergence, is a trading indicator used in technical analysis of stock prices, created by Chervolino. It is designed to reveal changes in the strength,
direction, momentum, and duration of a trend in a stock's price. The RMTA MACD indicator (or "oscillator") is a collection of three time series calculated from historical price data, from the closing price.
The RMTA MACD based on the THE RECURSIVE MOVING TRENDLINE SYSTEM technical.traders.com/archive/articlefinal.asp?file=\V16\C12\091YEN.pdf
and is series is the difference between a "fast" (short period) Recursive Moving Trend Average, and a "slow" (longer period) Recursive Moving Trend Average of the price series. The average series is an EMA of the MACD series itself.
The result is a non laging indicator, depends on the settings.
special thanks to
everget
LonesomeTheBlue
開源腳本
秉持TradingView一貫精神,這個腳本的創作者將其設為開源,以便交易者檢視並驗證其功能。向作者致敬!您可以免費使用此腳本,但請注意,重新發佈代碼需遵守我們的社群規範。
免責聲明
這些資訊和出版物並非旨在提供,也不構成TradingView提供或認可的任何形式的財務、投資、交易或其他類型的建議或推薦。請閱讀使用條款以了解更多資訊。
開源腳本
秉持TradingView一貫精神,這個腳本的創作者將其設為開源,以便交易者檢視並驗證其功能。向作者致敬!您可以免費使用此腳本,但請注意,重新發佈代碼需遵守我們的社群規範。
免責聲明
這些資訊和出版物並非旨在提供,也不構成TradingView提供或認可的任何形式的財務、投資、交易或其他類型的建議或推薦。請閱讀使用條款以了解更多資訊。