INVITE-ONLY SCRIPT
已更新 PT High Low

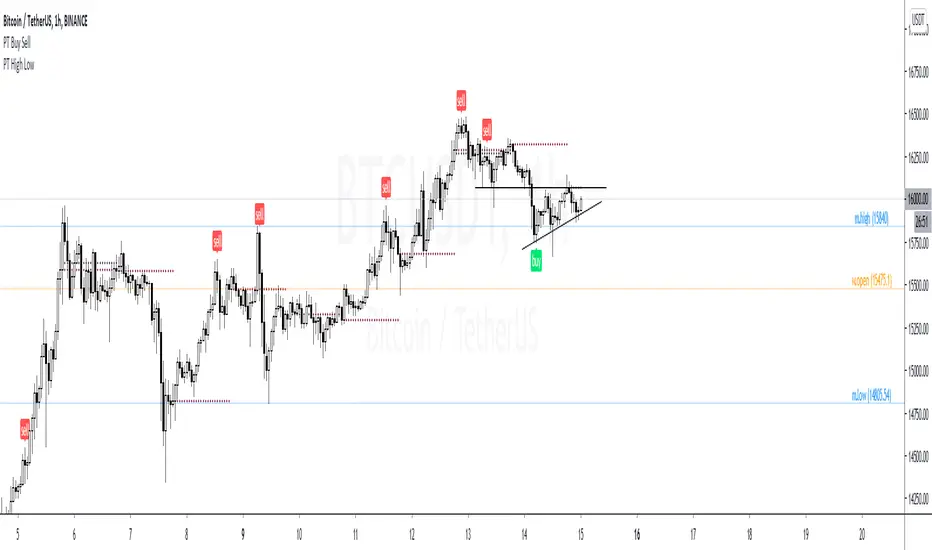
Version 1.0 of our PT High Low indicator helps create a visual for the Daily, Weekly, Monthly & Yearly range. These levels will give you an idea of where the price can react if reached. Consider them pivotal areas. We included a toggle that will help you go between the candle's High/Low to the candle's Open/Close. Both features are unique when scalping & swinging. The High/Low will paint a beautiful visual for your day to day trading & the Open/Close will help you determine where price maxed opened & closed for that specified timeframe.
Strategy:
Price tends to gravitate between the Daily level when playing intraday scalps. If playing the weekly, you want to be above the weekly pivot to punt longs & under the weekly level to punt shorts. More likely than not, when the price hits a monthly or yearly level, we get a noticeable reaction off it.
This Oscillator was built around our buy sell indicator & it is used on all time frames for swinging & scalping. It is included as part of the library. Just message us for access!
發行說明
V 1.1Update: Added Monday High/Low & Open/Close
發行說明
V 2.0-Added PT Mode which identifies Monday High, Monday Low, & Weekly Open for you on the fly. Extended lines were added for a visual.
-Added Monday, Daily, Weekly, Monthly & Yearly, High, Low, Open & Close.
發行說明
V 2.1-Added CME Close.
-Cleaned visual.
僅限邀請腳本
僅作者批准的使用者才能訪問此腳本。您需要申請並獲得使用許可,通常需在付款後才能取得。更多詳情,請依照作者以下的指示操作,或直接聯絡patterntraders。
TradingView不建議在未完全信任作者並了解其運作方式的情況下購買或使用腳本。您也可以在我們的社群腳本中找到免費的開源替代方案。
作者的說明
Join our telegram & discord for updates on our indicators & setups
✔ Website: whop.com/patterntraders
✔ Telegram: t.co/svvfkV3H7I?amp=1
✔ Discord: discord.gg/bqvYxc3
✔ Twitter: twitter.com/onlypatterns
✔ Website: whop.com/patterntraders
✔ Telegram: t.co/svvfkV3H7I?amp=1
✔ Discord: discord.gg/bqvYxc3
✔ Twitter: twitter.com/onlypatterns
免責聲明
這些資訊和出版物並非旨在提供,也不構成TradingView提供或認可的任何形式的財務、投資、交易或其他類型的建議或推薦。請閱讀使用條款以了解更多資訊。