OPEN-SOURCE SCRIPT
PHD-Points
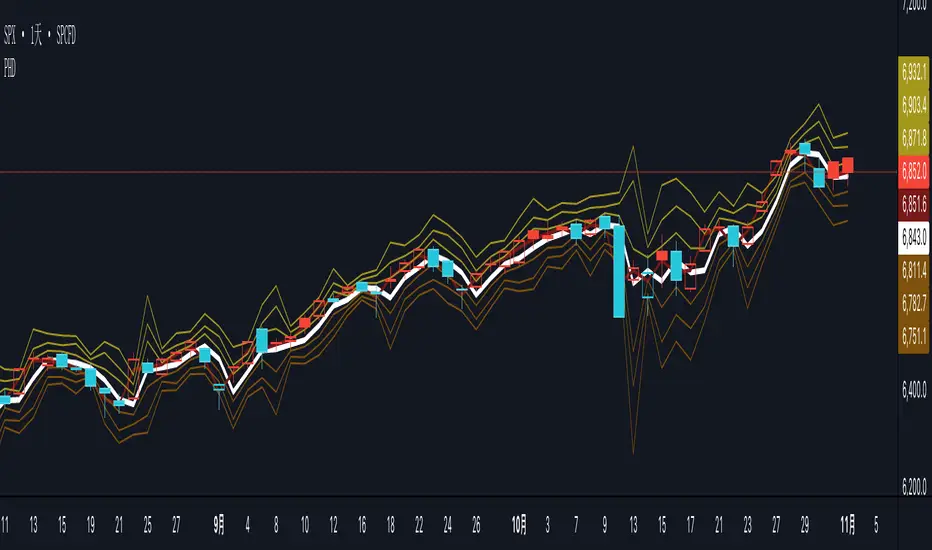
The PHD Pivot Points indicator is a professional-grade support and resistance tool that calculates key price levels based on previous day's price action and current intraday data. It provides traders with multiple reference points for identifying potential reversal zones, breakout levels, and strategic entry/exit positions.
Key Components
1. Previous Day Pivot Point (P)
White Line - The main pivot level calculated from previous day's High, Low, and Close
Formula: P = (Previous High + Previous Low + Previous Close) / 3
Serves as the central reference point for the trading day
Often acts as a psychological support/resistance level
2. Previous Day Support Levels (D1, D2, D3)
Brown Lines - Three support levels below the previous day's pivot
D1 (Support 1): First support level, closest to pivot
D2 (Support 2): Second support level, medium-strength
D3 (Support 3): Third support level, strongest support
Calculated using previous day's high and low ranges
3. Previous Day Resistance Levels (H1, H2, H3)
Yellow-Brown Lines - Three resistance levels above the previous day's pivot
H1 (Resistance 1): First resistance level, closest to pivot
H2 (Resistance 2): Second resistance level, medium-strength
H3 (Resistance 3): Third resistance level, strongest resistance
Calculated using previous day's high and low ranges
4. Today's Pivot Point (PT)
Dark Red Line - Dynamic pivot point that updates throughout the current trading session
Formula: PT = (Current High + Current Low + Current Close) / 3
Provides real-time trend reference for intraday trading
Helps identify intraday momentum and trend strength
5. Today's Dynamic Levels (DD1-DD3, HH1-HH3)
Calculated but not plotted by default
These values represent current session's support and resistance levels
Can be used for advanced intraday analysis
Trading Applications
Support and Resistance Trading
Price tends to bounce at D1, D2, D3 levels (potential buy zones)
Price tends to stall or reverse at H1, H2, H3 levels (potential sell zones)
Breaks above/below these levels signal trend strength
Trend Identification
Price above P = Bullish bias
Price below P = Bearish bias
PT line angle shows intraday momentum direction
開源腳本
秉持TradingView一貫精神,這個腳本的創作者將其設為開源,以便交易者檢視並驗證其功能。向作者致敬!您可以免費使用此腳本,但請注意,重新發佈代碼需遵守我們的社群規範。
免責聲明
這些資訊和出版物並非旨在提供,也不構成TradingView提供或認可的任何形式的財務、投資、交易或其他類型的建議或推薦。請閱讀使用條款以了解更多資訊。
免責聲明
這些資訊和出版物並非旨在提供,也不構成TradingView提供或認可的任何形式的財務、投資、交易或其他類型的建議或推薦。請閱讀使用條款以了解更多資訊。