OPEN-SOURCE SCRIPT
Slope
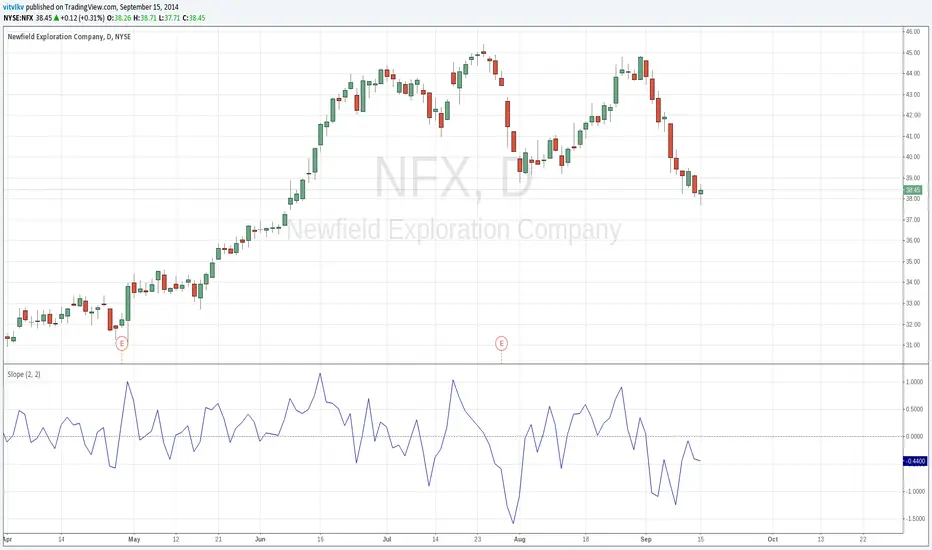
The slope indicator measures the rise-over-run of a linear regression, which is the line of best fit for a price series. Fluctuating above and below zero, the Slope indicator best resembles a momentum oscillator without boundaries. It is not well suited for overbought/oversold levels, but can measure the direction and strength of a trend. It can also be used with other indicators do identify potential entry points within an ongoing trend. (stockcharts.com/school/doku.php?id=chart_school:technical_indicators:slope)
開源腳本
秉持TradingView一貫精神,這個腳本的創作者將其設為開源,以便交易者檢視並驗證其功能。向作者致敬!您可以免費使用此腳本,但請注意,重新發佈代碼需遵守我們的社群規範。
免責聲明
這些資訊和出版物並非旨在提供,也不構成TradingView提供或認可的任何形式的財務、投資、交易或其他類型的建議或推薦。請閱讀使用條款以了解更多資訊。
免責聲明
這些資訊和出版物並非旨在提供,也不構成TradingView提供或認可的任何形式的財務、投資、交易或其他類型的建議或推薦。請閱讀使用條款以了解更多資訊。