OPEN-SOURCE SCRIPT
已更新 Multi-Timeframe EMA Table (Woche, Tag, 4h, 1h)
Title: Multi-Timeframe EMA Table (Weekly, Daily, 4h, 1h)
Description:
This Pine Script indicator provides a concise and clear Multi-Timeframe (MTF) Exponential Moving Average (EMA) analysis directly on your TradingView chart. It displays the EMA values for the 1-hour, 4-hour, 1-day, and 1-week timeframes in a customizable table.
Features:
Clear Table Display: Shows the current EMA values for predefined higher timeframes (1h, 4h, Day, Week).
Dynamic Status: The status column immediately visualizes whether the current price of your chart is above (Green) or below (Red) its respective Multi-Timeframe EMA.
Customizable EMA Length: The length of the EMA can be easily adjusted via the indicator settings, allowing you to tailor it to your preferred analysis.
Visual Confirmation: The corresponding Multi-Timeframe EMA lines are optionally plotted directly on the chart to visually confirm the table values.
Non-Repainting: The displayed EMA values and lines are programmed to be non-repainting, meaning their values do not change on already closed candles.
This indicator is a useful tool for traders who want to quickly get an overview of the EMA's position across different timeframes without constantly switching their chart timeframe. It's ideal for confirming trends and identifying support and resistance levels from a higher perspective.
發行說明
This Pine Script is an indicator designed for use on TradingView charts. Its primary purpose is to display a Multi-Timeframe (MTF) Exponential Moving Average (EMA) Table directly on the chart, providing a quick overview of EMA values across different timeframes.Key functionalities:
Multi-Timeframe EMA Calculation: It calculates and retrieves EMA values for specific higher timeframes (1-hour, 4-hour, Daily, and Weekly) regardless of the chart's current timeframe.
Non-Repainting: The EMA values are fetched in a way that ensures they do not "repaint," meaning their values on historical (closed) candles remain stable and do not change after the bar closes. This is achieved using the request.security function with appropriate lookahead and barstate indexing ([barstate.isrealtime ? 1 : 0]).
Customizable EMA Length: Users can specify the length of the EMA (e.g., EMA 15) via an input setting in the indicator's properties.
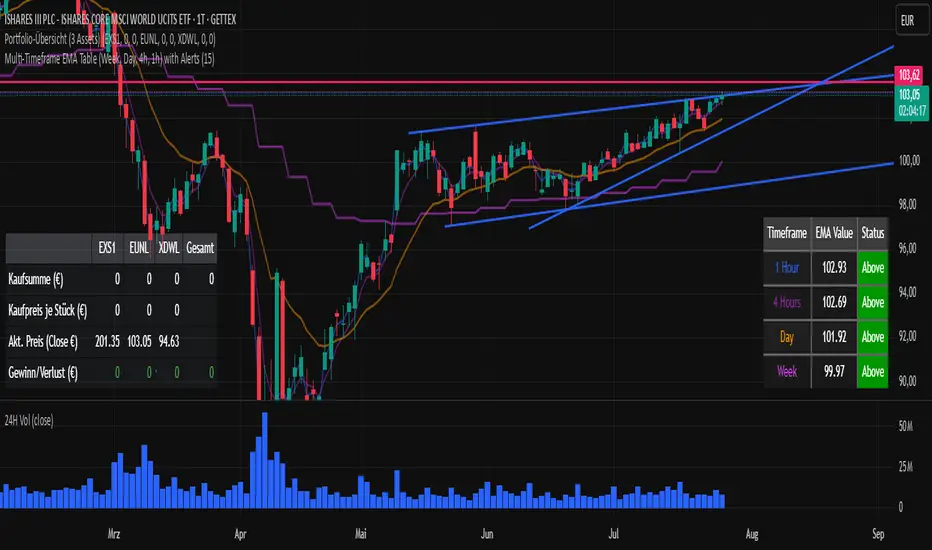
Interactive Table Display: A table is created and positioned in the bottom-right corner of the chart (position can be changed). This table shows:
The respective timeframe (e.g., "1 Stunde", "Tag").
The calculated EMA value for that timeframe, formatted to two decimal places.
A "Status" (Über/Unter, or Above/Below) indicating whether the chart's current close price is above or below that specific MTF EMA, highlighted with green (Above) or red (Below) background.
Optional On-Chart EMA Plots: For visual confirmation, the indicator also plots each of the calculated MTF EMA lines directly onto the main chart overlay, using distinct colors.
In essence, this script serves as a valuable tool for traders who want to quickly monitor key EMA levels from higher timeframes without constantly switching their chart's resolution.
發行說明
Purpose:This indicator provides a comprehensive trend overview by displaying the Exponential Moving Averages (EMAs) from four different timeframes (Weekly, Daily, 4h, 1h) simultaneously in a clear and organized table. It is ideal for traders who want to base their trading decisions on higher-level trends.
Key Features:
Visual Table: Shows the exact value of each EMA as well as the current status (price is "Above" or "Below" the EMA). The status cells are color-coded for quick recognition (green for above, red for below).
Color-Coded Correlation: The EMA lines are plotted directly on the chart for visual reference. The labels in the table (Weekly, Daily, etc.) are in the same color as their corresponding lines, allowing for intuitive association.
Customizable EMA Length: The period length for the EMA calculation can be freely adjusted in the settings.
Integrated Crossover Alerts: The indicator features a built-in alert function. You can be notified as soon as the price crosses one of the EMA lines, ensuring you don't miss important trend changes. The alerts can be enabled in the settings.
發行說明
Multi-Timeframe EMA Table with Alerts1. Purpose & Overview
This indicator provides a comprehensive trend overview by displaying the Exponential Moving Averages (EMAs) from four different timeframes (Weekly, Daily, 4h, 1h) simultaneously in a clear and organized table. It is the perfect tool for traders who want to align their trades with the dominant trend across multiple chart resolutions.
By seeing the status of higher timeframes at a glance, you can avoid trading against a strong underlying market direction and improve the probability of your setups.
2. Key Features
All-in-One Visual Table: Shows the exact value of each EMA and the current price status ("Above" or "Below" the EMA). The status cells are color-coded (green for bullish, red for bearish) for instant recognition.
Color-Coded Chart Lines: The EMA lines are plotted directly on your chart. To make them easy to identify, the timeframe labels in the table (e.g., "Daily") match the color of their corresponding line.
Customizable EMA Length: You can easily change the EMA period for all timeframes in the indicator's settings (default is 15).
Integrated Crossover Alerts: The script has a built-in alert system. You can get a notification whenever the price crosses any of the EMA lines, ensuring you never miss a potential trend shift.
3. How to Set Up Alerts
To receive notifications, you must create an alert in TradingView. Follow these simple steps:
Add this indicator to your chart.
Click the 'Alert' icon (the alarm clock) in the right-hand toolbar of TradingView.
In the 'Condition' dropdown menu, select the indicator: "Multi-Timeframe EMA Table...".
In the second dropdown menu right below it, you must choose the option: "Any alert() function call". This is the most important step.
Choose your preferred notification method (e.g., 'Notify on app', 'Show pop-up', 'Send email').
Click 'Create'.
Your alert is now active and will trigger based on the crossover conditions defined in the script.
Disclaimer
This indicator is for educational and informational purposes only and does not constitute financial, investment, or trading advice. Any trading decisions made based on the information generated by this indicator are the sole responsibility of the user.
Past performance is not indicative of future results. Trading in financial markets involves a high level of risk and is not suitable for all investors. You should carefully consider your investment objectives, level of experience, and risk appetite. Use of this script is at your own risk. The author assumes no liability for any losses incurred.
開源腳本
秉持TradingView一貫精神,這個腳本的創作者將其設為開源,以便交易者檢視並驗證其功能。向作者致敬!您可以免費使用此腳本,但請注意,重新發佈代碼需遵守我們的社群規範。
免責聲明
這些資訊和出版物並非旨在提供,也不構成TradingView提供或認可的任何形式的財務、投資、交易或其他類型的建議或推薦。請閱讀使用條款以了解更多資訊。
開源腳本
秉持TradingView一貫精神,這個腳本的創作者將其設為開源,以便交易者檢視並驗證其功能。向作者致敬!您可以免費使用此腳本,但請注意,重新發佈代碼需遵守我們的社群規範。
免責聲明
這些資訊和出版物並非旨在提供,也不構成TradingView提供或認可的任何形式的財務、投資、交易或其他類型的建議或推薦。請閱讀使用條款以了解更多資訊。