OPEN-SOURCE SCRIPT
已更新 [GYTS] Filters Toolkit
Filters Toolkit indicator
🌸 Part of GoemonYae Trading System (GYTS) 🌸
🌸 --------- 1. INTRODUCTION --------- 🌸
💮 Overview
The GYTS Filters Toolkit indicator is an advanced, interactive interface built atop the high‐performance, curated functions provided by the FiltersToolkit library. It allows traders to experiment with different combinations of filtering methods -— from smoothing low-pass filters to aggressive detrenders. With this toolkit, you can build custom indicators tailored to your specific trading strategy, whether you're looking for trend following, mean reversion, or cycle identification approaches.
🌸 --------- 2. FILTER METHODS AND TYPES --------- 🌸
💮 Filter categories
The available filters fall into four main categories, each marked with a distinct symbol:
🌗 Low Pass Filters (Smoothers)
These filters attenuate high-frequency components (noise) while allowing low-frequency components (trends) to pass through. Examples include:
Low pass filters are displayed on the price chart by default, as they follow the overall price movement. If they are combined with a high-pass or bandpass filter, they will be displayed in the subgraph.
🌓 High Pass Filters (Detrenders)
These filters do the opposite of low pass filters - they remove low-frequency components (trends) while allowing high-frequency components to pass through. Examples include:
High pass filters are displayed as oscillators in the subgraph below the price chart, as they fluctuate around a zero line.
🌑 Band Pass Filters (Cycle Isolators)
These filters combine aspects of both low and high pass filters, isolating specific frequency ranges while attenuating both higher and lower frequencies. Examples include:
Band pass filters are also displayed as oscillators in a separate panel.
🔮 Predictive Filter
Note that the the library contains elaborate documentation and source material of each filter.
🌸 --------- 3. INDICATOR FEATURES --------- 🌸
💮 Multi-filter configuration
One of the most powerful aspects of this indicator is the ability to configure multiple filters. compare them and observe their combined effects. There are four primary filters, each with its own parameter settings.
💮 Post-filtering
Process a filter’s output through an additional filter by enabling the post-filter option. This creates a filter chain where the output of one filter becomes the input to another. Some powerful combinations include:
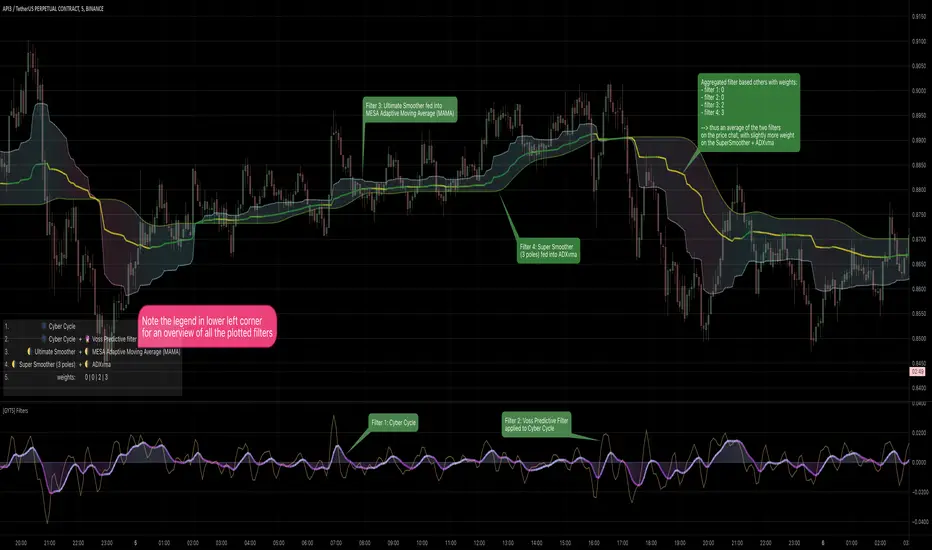
💮 Aggregate filters
Arguably the coolest feature: aggregating filters allow you to combine multiple filters with different weights. Important notes about aggregation:
💮 Rich visualisation & alerts
🌸 --------- 4. ACKNOWLEDGEMENTS --------- 🌸
This toolkit builds on the work of numerous pioneers in technical analysis and digital signal processing:
🌸 Part of GoemonYae Trading System (GYTS) 🌸
🌸 --------- 1. INTRODUCTION --------- 🌸
💮 Overview
The GYTS Filters Toolkit indicator is an advanced, interactive interface built atop the high‐performance, curated functions provided by the FiltersToolkit library. It allows traders to experiment with different combinations of filtering methods -— from smoothing low-pass filters to aggressive detrenders. With this toolkit, you can build custom indicators tailored to your specific trading strategy, whether you're looking for trend following, mean reversion, or cycle identification approaches.
🌸 --------- 2. FILTER METHODS AND TYPES --------- 🌸
💮 Filter categories
The available filters fall into four main categories, each marked with a distinct symbol:
🌗 Low Pass Filters (Smoothers)
These filters attenuate high-frequency components (noise) while allowing low-frequency components (trends) to pass through. Examples include:
- Ultimate Smoother
- Super Smoother (2-pole and 3-pole variants)
- MESA Adaptive Moving Average (MAMA) and Following Adaptive Moving Average (FAMA)
- BiQuad Low Pass Filter
- ADXvma (Adaptive Directional Volatility Moving Average)
- A2RMA (Adaptive Autonomous Recursive Moving Average)
Low pass filters are displayed on the price chart by default, as they follow the overall price movement. If they are combined with a high-pass or bandpass filter, they will be displayed in the subgraph.
🌓 High Pass Filters (Detrenders)
These filters do the opposite of low pass filters - they remove low-frequency components (trends) while allowing high-frequency components to pass through. Examples include:
- Butterworth High Pass Filter
- BiQuad High Pass Filter
High pass filters are displayed as oscillators in the subgraph below the price chart, as they fluctuate around a zero line.
🌑 Band Pass Filters (Cycle Isolators)
These filters combine aspects of both low and high pass filters, isolating specific frequency ranges while attenuating both higher and lower frequencies. Examples include:
- Ehlers Bandpass Filter
- Cyber Cycle
- Relative Vigor Index (RVI)
- BiQuad Bandpass Filter
Band pass filters are also displayed as oscillators in a separate panel.
🔮 Predictive Filter
- Voss Predictive Filter: A special filter that attempts to predict future values of band-limited signals (only to be used as post-filter). Keep its prediction horizon short (1–3 bars) for reasonable accuracy.
Note that the the library contains elaborate documentation and source material of each filter.
🌸 --------- 3. INDICATOR FEATURES --------- 🌸
💮 Multi-filter configuration
One of the most powerful aspects of this indicator is the ability to configure multiple filters. compare them and observe their combined effects. There are four primary filters, each with its own parameter settings.
💮 Post-filtering
Process a filter’s output through an additional filter by enabling the post-filter option. This creates a filter chain where the output of one filter becomes the input to another. Some powerful combinations include:
- Ultimate Smoother → MAMA: Creates an adaptive smoothing effect that responds well to market changes, good for trend-following strategies
- Butterworth → Super Smoother → Butterworth: Produces a well-behaved oscillator with minimal phase distortion, John Ehlers also calls a "roofing filter". Great for identifying overbought/oversold conditions with minimal lag.
- A bandpass filter → Voss Prediction filter: Attempts to predict future movements of cyclical components, handy to find peaks and troughs of the market cycle.
💮 Aggregate filters
Arguably the coolest feature: aggregating filters allow you to combine multiple filters with different weights. Important notes about aggregation:
- You can only aggregate filters that appear on the same chart (price chart or oscillator panel).
- The weights are automatically normalised, so only their relative values matter
- Setting a weight to 0 (zero) excludes that filter from the aggregation
- Filters don't need to be visibly displayed to be included in aggregation
💮 Rich visualisation & alerts
- The indicator intelligently determines whether a filter is displayed on the price chart or in the subgraph (as an oscillator) based on its characteristics.
- Dynamic colour palettes, adjustable line widths, transparency, and custom fill between any of enabled filters or between oscillators and the zero-line.
- A clear legend showing which filters are active and how they're configured
- Alerts for direction changes and crossovers of all filters
🌸 --------- 4. ACKNOWLEDGEMENTS --------- 🌸
This toolkit builds on the work of numerous pioneers in technical analysis and digital signal processing:
- John Ehlers, whose groundbreaking research forms the foundation of many filters.
- Robert Bristow-Johnson for the BiQuad filter formulations.
- The TradingView community, especially The_Peaceful_Lizard, alexgrover, and others mentioned in the code of the library.
- Everyone who has provided feedback, testing and support!
發行說明
New Filters Added- Ultimate Smoother (3-pole) - A GoemonYae created new smoother with different characteristics compared to John Ehlers' original 2-pole version. Provides zero lag at all times with configurable smoothness.
- Butterworth (1-pole) High Pass Filter - A simplified version of the Butterworth high-pass filter family with less lag than the 2-pole version.
開源腳本
秉持TradingView一貫精神,這個腳本的創作者將其設為開源,以便交易者檢視並驗證其功能。向作者致敬!您可以免費使用此腳本,但請注意,重新發佈代碼需遵守我們的社群規範。
🌸 --- GoemonYae Trading System (GYTS) --- 🌸
・ Website: goemonyae.com
・ Documentation: goemonyae.com/docs
・ Discord server (incl. 🦊YaeBot): discord.gg/ef6Tu4kha3
・ personal LinkedIn: linkedin.com/in/arthur-nazarian
・ Website: goemonyae.com
・ Documentation: goemonyae.com/docs
・ Discord server (incl. 🦊YaeBot): discord.gg/ef6Tu4kha3
・ personal LinkedIn: linkedin.com/in/arthur-nazarian
免責聲明
這些資訊和出版物並非旨在提供,也不構成TradingView提供或認可的任何形式的財務、投資、交易或其他類型的建議或推薦。請閱讀使用條款以了解更多資訊。