Hello!
BE SURE TO RUN THE SCRIPT WITH BAR REPLAY TO SEE WHAT IT DOES! I hope you like it!
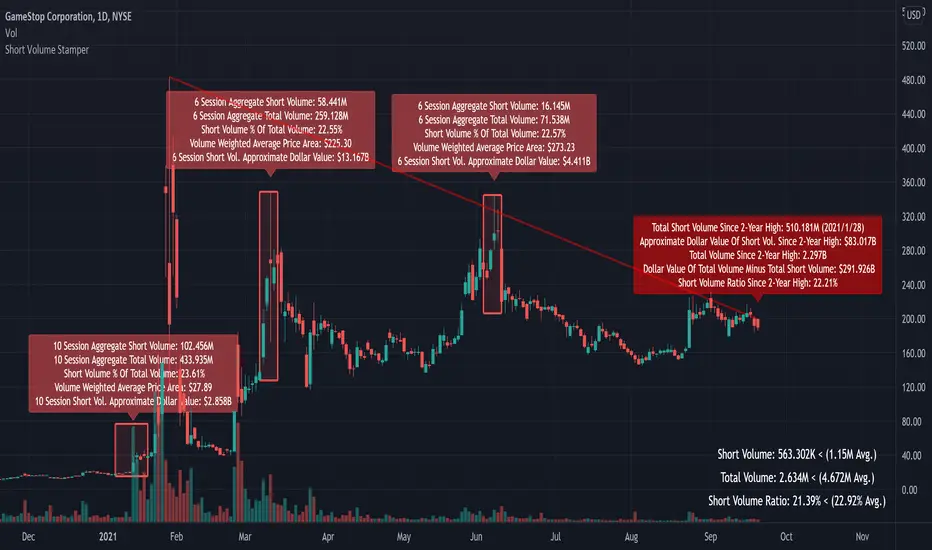
This script calculates the total short volume, total volume, and the short volume / total volume ratio since the 2-year high price. In addition, the approximate dollar value of all short volume since the 2-year high, and the approximate dollar value of all non-short sell volume since the 2-year high is calculated using VWAP. A red line (short interest ratio >= 20%) connects the 2-year high to current session’s high price; a green line (short interest ratio < 20%) connects the 2-year high to the current session’s high.
The script also “stamps” sessions in which a NEW 1-year high in SHORT volume is achieved, and when a PIVOT POINT high is achieved (highest high over 51 sessions). When a new high in short volume is achieved the script aggregates the total volume and short volume for the 5 sessions prior to the new high, the session of the new high, and the 4 sessions after the new high (10 sessions). Additional volume calculations are performed for the 10 session period!
When a pivot point high is achieved the script aggregates the total volume and short volume for the 3 sessions prior to the pivot high, the session of the pivot high, and the 2 sessions after the new high (6 sessions). Additional volume calculations are performed for the 6 session period!
Red labels, red boxes, and red lines indicate a short volume ratio greater than or equal to 20% over the corresponding period!
Green labels, green boxes, and green lines indicate a short volume ratio less than 20% over the corresponding period!
BE SURE TO RUN THE SCRIPT WITH BAR REPLAY TO SEE WHAT IT DOES! I hope you like it!
This script calculates the total short volume, total volume, and the short volume / total volume ratio since the 2-year high price. In addition, the approximate dollar value of all short volume since the 2-year high, and the approximate dollar value of all non-short sell volume since the 2-year high is calculated using VWAP. A red line (short interest ratio >= 20%) connects the 2-year high to current session’s high price; a green line (short interest ratio < 20%) connects the 2-year high to the current session’s high.
The script also “stamps” sessions in which a NEW 1-year high in SHORT volume is achieved, and when a PIVOT POINT high is achieved (highest high over 51 sessions). When a new high in short volume is achieved the script aggregates the total volume and short volume for the 5 sessions prior to the new high, the session of the new high, and the 4 sessions after the new high (10 sessions). Additional volume calculations are performed for the 10 session period!
When a pivot point high is achieved the script aggregates the total volume and short volume for the 3 sessions prior to the pivot high, the session of the pivot high, and the 2 sessions after the new high (6 sessions). Additional volume calculations are performed for the 6 session period!
Red labels, red boxes, and red lines indicate a short volume ratio greater than or equal to 20% over the corresponding period!
Green labels, green boxes, and green lines indicate a short volume ratio less than 20% over the corresponding period!
發行說明
Changed the tracking label y-axis plot. The tracking label will trail price a bit tighter!發行說明
Added name發行說明
Memory calculation compliant開源腳本
秉持TradingView一貫精神,這個腳本的創作者將其設為開源,以便交易者檢視並驗證其功能。向作者致敬!您可以免費使用此腳本,但請注意,重新發佈代碼需遵守我們的社群規範。
•Access to Next-Gen Optimization Tools: tradingiq.io
•Discord Server: discord.gg/aKWPuM4HPy
•Discord Server: discord.gg/aKWPuM4HPy
免責聲明
這些資訊和出版物並非旨在提供,也不構成TradingView提供或認可的任何形式的財務、投資、交易或其他類型的建議或推薦。請閱讀使用條款以了解更多資訊。
開源腳本
秉持TradingView一貫精神,這個腳本的創作者將其設為開源,以便交易者檢視並驗證其功能。向作者致敬!您可以免費使用此腳本,但請注意,重新發佈代碼需遵守我們的社群規範。
•Access to Next-Gen Optimization Tools: tradingiq.io
•Discord Server: discord.gg/aKWPuM4HPy
•Discord Server: discord.gg/aKWPuM4HPy
免責聲明
這些資訊和出版物並非旨在提供,也不構成TradingView提供或認可的任何形式的財務、投資、交易或其他類型的建議或推薦。請閱讀使用條款以了解更多資訊。