OPEN-SOURCE SCRIPT
已更新 Gamma + Fibonacci EMA Bands
# Gamma + Fibonacci EMA Bands
## Overview
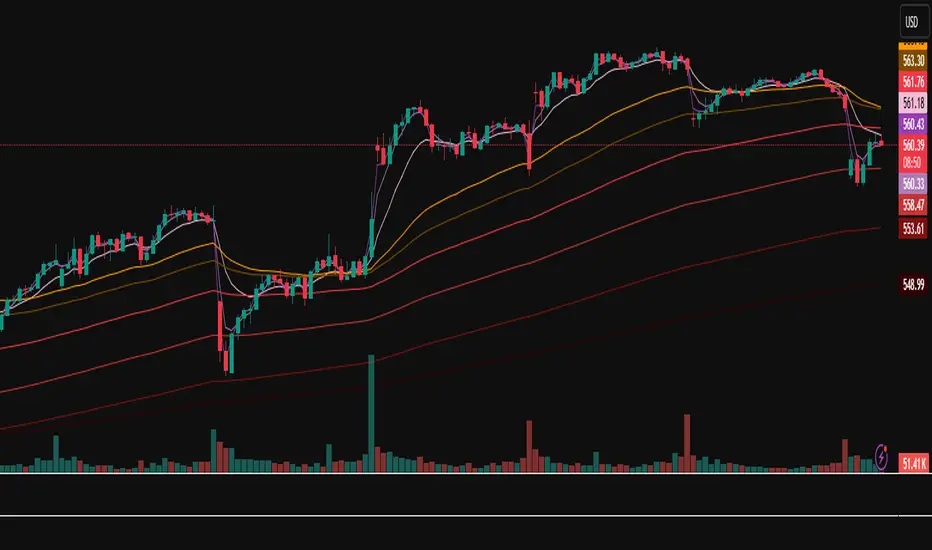
The Gamma + Fibonacci EMA Bands indicator combines two powerful analytical approaches: Gamma-weighted Exponential Moving Averages and Fibonacci sequence-based standard EMAs. This dual system creates a comprehensive "band" structure that helps identify trend direction, strength, and potential reversal zones with greater precision than single moving average systems.
## Features
- **Gamma-weighted EMAs**: Three customizable Gamma EMAs (fast-responding) with adjustable gamma parameters
- **Fibonacci Sequence EMAs**: Six standard EMAs based on the Fibonacci sequence (34, 55, 89, 144, 233, 377)
- **Visual Band Structure**: Color-coded for instant visual analysis
- **Trend Confirmation**: Multiple timeframe validation through varied moving average periods
- **Support/Resistance Identification**: Natural price reaction zones highlighted by EMA confluences
## How It Works
The indicator uses two complementary EMA systems:
1. **Gamma EMAs** (γ-EMAs) - These responsive moving averages use a direct gamma weighting factor (between 0-1) rather than a period length. Lower gamma values create smoother lines, while higher values create more responsive ones. These react quickly to price changes and serve as short-term trend indicators.
2. **Fibonacci EMAs** - These traditional EMAs use period lengths based on the Fibonacci sequence (34, 55, 89, 144, 233, 377). They provide longer-term trend context and naturally identify key support/resistance levels that align with market psychology.
## Interpretation
### Trend Direction
- When price is above all bands: Strong bullish trend
- When price is below all bands: Strong bearish trend
- When price is between bands: Consolidation or trend transition
### Support/Resistance
- Gamma EMAs (purple shades): Short-term dynamic support/resistance
- Fibonacci EMAs (orange/red shades): Stronger, longer-term support/resistance
### Trend Strength
- Wider band separation: Stronger trend momentum
- Compressed bands: Consolidation or trend weakness
### Reversal Signals
- Price breaking through multiple bands: Potential trend reversal
- Gamma EMAs crossing Fibonacci EMAs: Changing momentum
## Settings
- **Source**: Price data source (default: close)
- **Gamma 1**: Fast γ-EMA value (default: 0.2)
- **Gamma 2**: Medium γ-EMA value (default: 0.5)
- **Gamma 3**: Slow γ-EMA value (default: 0.8)
## Notes
This indicator works best on higher timeframes (1H+) and liquid markets. The Gamma-weighted EMAs provide faster signals while the Fibonacci sequence EMAs provide reliable support/resistance levels that often align with key market turning points.
For optimal use, watch for price interaction with these bands and how the bands interact with each other to confirm trend changes before they become obvious to the majority of market participants.
## Overview
The Gamma + Fibonacci EMA Bands indicator combines two powerful analytical approaches: Gamma-weighted Exponential Moving Averages and Fibonacci sequence-based standard EMAs. This dual system creates a comprehensive "band" structure that helps identify trend direction, strength, and potential reversal zones with greater precision than single moving average systems.
## Features
- **Gamma-weighted EMAs**: Three customizable Gamma EMAs (fast-responding) with adjustable gamma parameters
- **Fibonacci Sequence EMAs**: Six standard EMAs based on the Fibonacci sequence (34, 55, 89, 144, 233, 377)
- **Visual Band Structure**: Color-coded for instant visual analysis
- **Trend Confirmation**: Multiple timeframe validation through varied moving average periods
- **Support/Resistance Identification**: Natural price reaction zones highlighted by EMA confluences
## How It Works
The indicator uses two complementary EMA systems:
1. **Gamma EMAs** (γ-EMAs) - These responsive moving averages use a direct gamma weighting factor (between 0-1) rather than a period length. Lower gamma values create smoother lines, while higher values create more responsive ones. These react quickly to price changes and serve as short-term trend indicators.
2. **Fibonacci EMAs** - These traditional EMAs use period lengths based on the Fibonacci sequence (34, 55, 89, 144, 233, 377). They provide longer-term trend context and naturally identify key support/resistance levels that align with market psychology.
## Interpretation
### Trend Direction
- When price is above all bands: Strong bullish trend
- When price is below all bands: Strong bearish trend
- When price is between bands: Consolidation or trend transition
### Support/Resistance
- Gamma EMAs (purple shades): Short-term dynamic support/resistance
- Fibonacci EMAs (orange/red shades): Stronger, longer-term support/resistance
### Trend Strength
- Wider band separation: Stronger trend momentum
- Compressed bands: Consolidation or trend weakness
### Reversal Signals
- Price breaking through multiple bands: Potential trend reversal
- Gamma EMAs crossing Fibonacci EMAs: Changing momentum
## Settings
- **Source**: Price data source (default: close)
- **Gamma 1**: Fast γ-EMA value (default: 0.2)
- **Gamma 2**: Medium γ-EMA value (default: 0.5)
- **Gamma 3**: Slow γ-EMA value (default: 0.8)
## Notes
This indicator works best on higher timeframes (1H+) and liquid markets. The Gamma-weighted EMAs provide faster signals while the Fibonacci sequence EMAs provide reliable support/resistance levels that often align with key market turning points.
For optimal use, watch for price interaction with these bands and how the bands interact with each other to confirm trend changes before they become obvious to the majority of market participants.
發行說明
# Gamma + Fibonacci EMA Bands## Overview
The Gamma + Fibonacci EMA Bands indicator combines two powerful analytical approaches: Gamma-weighted Exponential Moving Averages and Fibonacci sequence-based standard EMAs. This dual system creates a comprehensive "band" structure that helps identify trend direction, strength, and potential reversal zones with greater precision than single moving average systems.
## Features
- **Gamma-weighted EMAs**: Three customizable Gamma EMAs (fast-responding) with adjustable gamma parameters
- **Fibonacci Sequence EMAs**: Six standard EMAs based on the Fibonacci sequence (34, 55, 89, 144, 233, 377)
- **Visual Band Structure**: Color-coded for instant visual analysis
- **Trend Confirmation**: Multiple timeframe validation through varied moving average periods
- **Support/Resistance Identification**: Natural price reaction zones highlighted by EMA confluences
## How It Works
The indicator uses two complementary EMA systems:
1. **Gamma EMAs** (γ-EMAs) - These responsive moving averages use a direct gamma weighting factor (between 0-1) rather than a period length. Lower gamma values create smoother lines, while higher values create more responsive ones. These react quickly to price changes and serve as short-term trend indicators.
2. **Fibonacci EMAs** - These traditional EMAs use period lengths based on the Fibonacci sequence (34, 55, 89, 144, 233, 377). They provide longer-term trend context and naturally identify key support/resistance levels that align with market psychology.
## Interpretation
### Trend Direction
- When price is above all bands: Strong bullish trend
- When price is below all bands: Strong bearish trend
- When price is between bands: Consolidation or trend transition
### Support/Resistance
- Gamma EMAs (purple shades): Short-term dynamic support/resistance
- Fibonacci EMAs (orange/red shades): Stronger, longer-term support/resistance
### Trend Strength
- Wider band separation: Stronger trend momentum
- Compressed bands: Consolidation or trend weakness
### Reversal Signals
- Price breaking through multiple bands: Potential trend reversal
- Gamma EMAs crossing Fibonacci EMAs: Changing momentum
## Settings
- **Source**: Price data source (default: close)
- **Gamma 1**: Fast γ-EMA value (default: 0.2)
- **Gamma 2**: Medium γ-EMA value (default: 0.5)
- **Gamma 3**: Slow γ-EMA value (default: 0.8)
## Notes
This indicator works best on higher timeframes (1H+) and liquid markets. The Gamma-weighted EMAs provide faster signals while the Fibonacci sequence EMAs provide reliable support/resistance levels that often align with key market turning points.
For optimal use, watch for price interaction with these bands and how the bands interact with each other to confirm trend changes before they become obvious to the majority of market participants.
開源腳本
秉持TradingView一貫精神,這個腳本的創作者將其設為開源,以便交易者檢視並驗證其功能。向作者致敬!您可以免費使用此腳本,但請注意,重新發佈代碼需遵守我們的社群規範。
免責聲明
這些資訊和出版物並非旨在提供,也不構成TradingView提供或認可的任何形式的財務、投資、交易或其他類型的建議或推薦。請閱讀使用條款以了解更多資訊。
開源腳本
秉持TradingView一貫精神,這個腳本的創作者將其設為開源,以便交易者檢視並驗證其功能。向作者致敬!您可以免費使用此腳本,但請注意,重新發佈代碼需遵守我們的社群規範。
免責聲明
這些資訊和出版物並非旨在提供,也不構成TradingView提供或認可的任何形式的財務、投資、交易或其他類型的建議或推薦。請閱讀使用條款以了解更多資訊。