OPEN-SOURCE SCRIPT
KST con HMA
---------- ENGLISH DESCRIPTION ----------
The indicator created is called "KST with HMA" and is used to measure the impulse of an asset's price.
The code begins by defining four variables representing ROC (Rate of Change) period lengths for calculating the KST (Know Sure Thing) and a variable for the length of the HMA (Hull Moving Average).
Next, an HMA function is defined to calculate the Hull Moving Average, a type of weighted moving average that adjusts for price volatility.
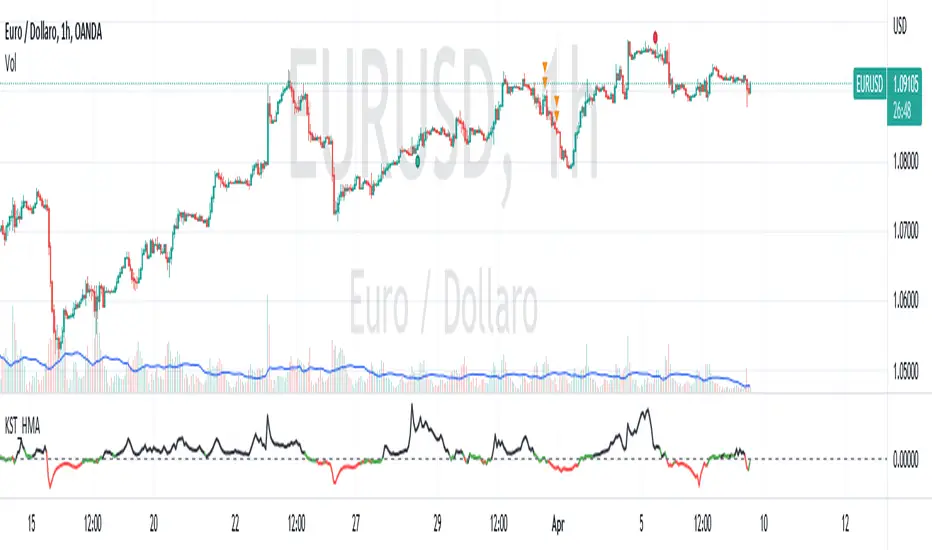
ROC values are then calculated for the four periods defined above and KST values are calculated as a weighted sum of the ROC values. These values are then normalized with the HMA and the standard deviation of the HMA is calculated. The normalized value is finally plotted with three different color lines: black for values greater than 1, red for values less than -1, and green for values between -1 and 1.
Finally, a black dashed line is plotted to represent the zero line. The green line indicates a phase of market uncertainty or lateralization, while the indicator can be used to identify buy points above zero and sell points below zero.
---------- ITALIAN DESCRIPTION ----------
L'indicatore creato è chiamato "KST con HMA" e viene utilizzato per misurare l'impulso del prezzo di un asset.
Il codice inizia definendo quattro variabili che rappresentano le lunghezze dei periodi di ROC (Rate of Change) per il calcolo del KST (Know Sure Thing) e una variabile per la lunghezza dell'HMA (Hull Moving Average).
Successivamente viene definita una funzione HMA per il calcolo della Hull Moving Average, un tipo di media mobile ponderata che si adatta alla volatilità del prezzo.
Vengono poi calcolati i valori ROC per i quattro periodi definiti in precedenza e calcolati i valori KST come somma ponderata dei valori ROC. Questi valori vengono poi normalizzati con l'HMA e viene calcolata la deviazione standard dell'HMA. Il valore normalizzato viene infine plottato con tre diverse linee di colore: nero per valori superiori a 1, rosso per valori inferiori a -1 e verde per valori tra -1 e 1.
Infine, viene plottata una linea tratteggiata nera per rappresentare la linea zero. La linea verde indica una fase di incertezza o lateralizzazione del mercato, mentre l'indicatore può essere utilizzato per individuare punti di acquisto sopra lo zero e di vendita al di sotto dello zero.
The indicator created is called "KST with HMA" and is used to measure the impulse of an asset's price.
The code begins by defining four variables representing ROC (Rate of Change) period lengths for calculating the KST (Know Sure Thing) and a variable for the length of the HMA (Hull Moving Average).
Next, an HMA function is defined to calculate the Hull Moving Average, a type of weighted moving average that adjusts for price volatility.
ROC values are then calculated for the four periods defined above and KST values are calculated as a weighted sum of the ROC values. These values are then normalized with the HMA and the standard deviation of the HMA is calculated. The normalized value is finally plotted with three different color lines: black for values greater than 1, red for values less than -1, and green for values between -1 and 1.
Finally, a black dashed line is plotted to represent the zero line. The green line indicates a phase of market uncertainty or lateralization, while the indicator can be used to identify buy points above zero and sell points below zero.
---------- ITALIAN DESCRIPTION ----------
L'indicatore creato è chiamato "KST con HMA" e viene utilizzato per misurare l'impulso del prezzo di un asset.
Il codice inizia definendo quattro variabili che rappresentano le lunghezze dei periodi di ROC (Rate of Change) per il calcolo del KST (Know Sure Thing) e una variabile per la lunghezza dell'HMA (Hull Moving Average).
Successivamente viene definita una funzione HMA per il calcolo della Hull Moving Average, un tipo di media mobile ponderata che si adatta alla volatilità del prezzo.
Vengono poi calcolati i valori ROC per i quattro periodi definiti in precedenza e calcolati i valori KST come somma ponderata dei valori ROC. Questi valori vengono poi normalizzati con l'HMA e viene calcolata la deviazione standard dell'HMA. Il valore normalizzato viene infine plottato con tre diverse linee di colore: nero per valori superiori a 1, rosso per valori inferiori a -1 e verde per valori tra -1 e 1.
Infine, viene plottata una linea tratteggiata nera per rappresentare la linea zero. La linea verde indica una fase di incertezza o lateralizzazione del mercato, mentre l'indicatore può essere utilizzato per individuare punti di acquisto sopra lo zero e di vendita al di sotto dello zero.
開源腳本
秉持TradingView一貫精神,這個腳本的創作者將其設為開源,以便交易者檢視並驗證其功能。向作者致敬!您可以免費使用此腳本,但請注意,重新發佈代碼需遵守我們的社群規範。
免責聲明
這些資訊和出版物並非旨在提供,也不構成TradingView提供或認可的任何形式的財務、投資、交易或其他類型的建議或推薦。請閱讀使用條款以了解更多資訊。
免責聲明
這些資訊和出版物並非旨在提供,也不構成TradingView提供或認可的任何形式的財務、投資、交易或其他類型的建議或推薦。請閱讀使用條款以了解更多資訊。