PROTECTED SOURCE SCRIPT
DVWAP Overlay Indicator
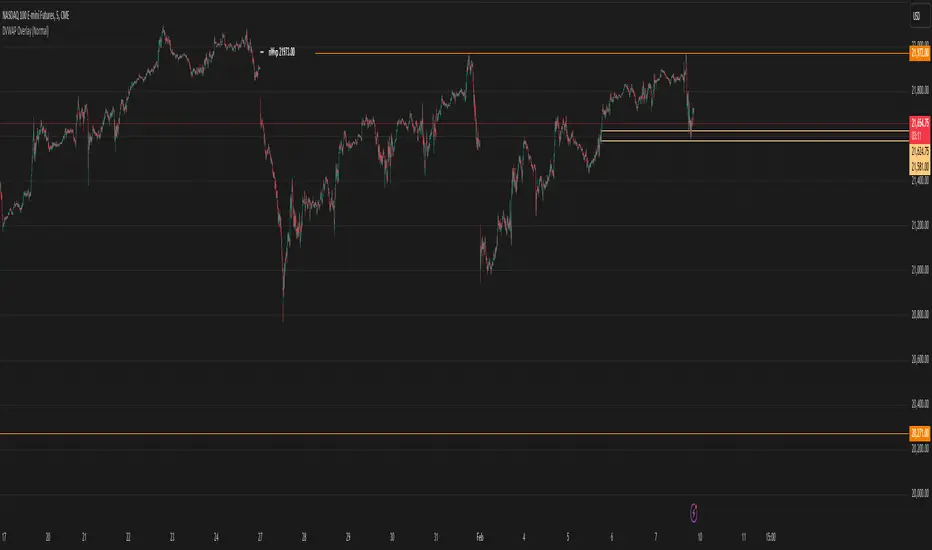
The DVWAP Overlay is a custom TradingView indicator designed to track Volume-Weighted Average Price (VWAP) levels over different time periods and visualize untapped VWAP levels on the price chart. It also includes historical VWAP tracking, which helps traders identify key support and resistance levels.
Key Features & Functionality
1. User Inputs & Settings
Text Size Selection: Allows users to choose the text size for labels (Tiny, Small, Normal, Large).
VWAP Display Options:
Option to show/hide VWAP levels.
Option to display Naked VWAP levels, meaning VWAP levels that have not been touched by price yet.
Color Customization: Users can configure colors for VWAP lines and labels.
2. VWAP Calculation & Plotting
Daily VWAP Calculation: The script calculates the VWAP for each daily session, adjusting at the start of a new day.
Standard Deviation Bands: The script also calculates the VWAP deviation (similar to Bollinger Bands).
Plotting VWAP: A line is drawn on the chart to visualize VWAP levels for the current and past sessions.
3. Untapped VWAP Level Tracking
The indicator keeps track of VWAP levels that have not yet been touched by price.
If price crosses a previous VWAP level, it is removed from the chart.
These untouched levels are highlighted and labeled on the chart.
4. Historical VWAP Levels
The indicator stores and plots previous VWAP levels, helping traders identify key historical price zones.
Two types of historical VWAPs are displayed:
Previous day VWAP (pdVWAP)
Historical Naked VWAP levels (nVWAP)
How Traders Can Use This Indicator
✅ Support & Resistance Identification: Helps traders find key VWAP levels that can act as support/resistance.
✅ Breakout & Rejection Trades: If price approaches an untouched VWAP, it could indicate a potential reaction.
✅ Institutional Order Flow Tracking: VWAP is often used by institutions for volume-based trade execution.
受保護腳本
此腳本以閉源形式發佈。 不過,您可以自由使用,沒有任何限制 — 點擊此處了解更多。
免責聲明
這些資訊和出版物並非旨在提供,也不構成TradingView提供或認可的任何形式的財務、投資、交易或其他類型的建議或推薦。請閱讀使用條款以了解更多資訊。
免責聲明
這些資訊和出版物並非旨在提供,也不構成TradingView提供或認可的任何形式的財務、投資、交易或其他類型的建議或推薦。請閱讀使用條款以了解更多資訊。