INVITE-ONLY SCRIPT
已更新 Weis Wave-Wave Types
Weis Wave - Waves Types indicator
The Concept
This indicator has been created based on David's Weis theory of cumulative volume histograms but this indicator has been enhanced with additional wave types to be able to identify the following:
What it does
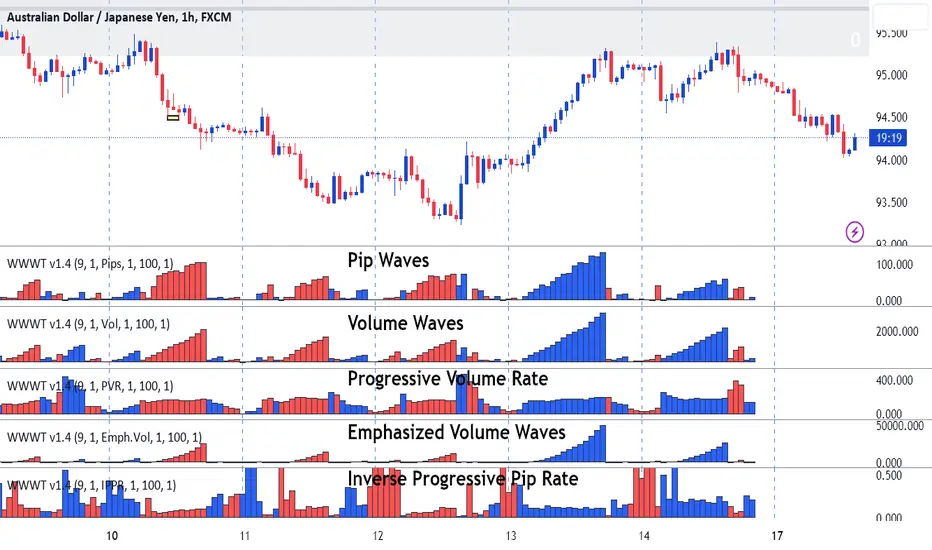
This indicator draws cumulative histograms of 5 different wave types. Up swing histogram is when price goes up and down swing histogram is when price goes down. It adds the volume of each bar within the wave swing, it adds the pips of each bar within the wave swing , it adds the time of each bar within the wave swing, it measures if the volume rate is increasing or decreasing within the wave swing and emphasizes on larger volume volume waves by increasing their size for visual purposes.
How it does it
The length of each cumulative histogram is equal to each wave price swing. The price wave sensitivity can be adjusted by AutoSensitivity parameter (min value =2 and max value=11). The larger the number the more sensitive it is, which means more wave swings will be created. The selectable values for the wave type are: Volume, Pips, Time, Progressive Volume Rate or Emphasized Volume. Furthermore the width of the cumulative histogram bars can be adjusted as well as the color of the up and the down swings. Finally divider input values are available for volume and pip to decrease large numbers on the y-axis of the histograms.
Wave Type Detailed Explanation
Volume: the indicator adds the volume of each bar within the price wave swing and creates a cumulative histogram
Pips: the indicator adds the bar distance from open to close and creates a cumulative histogram of the net pip movement of the price swing
Time: adds the time of each bar within the price wave swing and creates a cumulative histogram
Progressive Volume Rate (PVR): measures the volume rate within each wave (if volume is increasing or decreasing or staying steady as the wave progresses)
Emphasized Volume: the indicator adds the volume of each bar within the price wave swing and creates a cumulative histogram but contains an algorithm that emphasizes the large waves.
How to Use
Draw Support/Resistance and Fib - Monitor carefully the cumulative histograms at these levels. Usually supply and demand imbalance happens at this level.
First and most important of all adjust AutoSesnsitivity to get your swings correct. Getting the correct swings means waves are catching the tops and bottoms of each price wave swings.
Then identify potential trades by:
1. Comparison of cumulative Volume histogram vs Pip histogram which makes the concept of Wyckoff "Effort versus Result" identifiable, lot's of volume with small pip move = lot's of effort vs with small result. Supply and Demand imbalance.
2. Monitor Progressive Volume Rate histogram which measures if the volume rate is increasing, decreasing or remains steady within the price wave swing. This histogram indicates more or less participation as price increases or decreases within the specific wave. For example increase of volume rate as price goes up could mean more participation which could mean that sellers might be entering. Also the opposite is valid increasing volume rate as price goes down could mean that buyers are entering.
3. Emphasized Volume waves, provide a visual emphases on large volume waves only, useful for traders that like to trade with high volume trends and for traders that believe that in large volume waves large institutes participate. Trade with price trend but also with the volume trend concept.
What makes it unique
This indicator is an advance cumulative wave histogram because apart the regular volume histogram and apart form using each wave type individually to make a decision it provides more confidence and becomes more powerful when confluence is used combining the other wave types and by using the strategies mentioned above to a higher probability trade. Some examples are shown below
Example of Effort vs. Result Concept

Example of Progressive Volume Rate

Example of Emphasized Volume

The Concept
This indicator has been created based on David's Weis theory of cumulative volume histograms but this indicator has been enhanced with additional wave types to be able to identify the following:
- Visually identify the Effort vs Result concept (too much volume but small pip move or small volume too large pip move). Imbalance of Supply and Demand.
- Be able to monitor how volume progresses within the wave, if it is increasing, decreasing or staying steady.
- Identify easily the large volume waves using the emphasized volume algorithm to analyze the price reaction afterwards following the theory that Institutions participate on large volumes
What it does
This indicator draws cumulative histograms of 5 different wave types. Up swing histogram is when price goes up and down swing histogram is when price goes down. It adds the volume of each bar within the wave swing, it adds the pips of each bar within the wave swing , it adds the time of each bar within the wave swing, it measures if the volume rate is increasing or decreasing within the wave swing and emphasizes on larger volume volume waves by increasing their size for visual purposes.
How it does it
The length of each cumulative histogram is equal to each wave price swing. The price wave sensitivity can be adjusted by AutoSensitivity parameter (min value =2 and max value=11). The larger the number the more sensitive it is, which means more wave swings will be created. The selectable values for the wave type are: Volume, Pips, Time, Progressive Volume Rate or Emphasized Volume. Furthermore the width of the cumulative histogram bars can be adjusted as well as the color of the up and the down swings. Finally divider input values are available for volume and pip to decrease large numbers on the y-axis of the histograms.
Wave Type Detailed Explanation
Volume: the indicator adds the volume of each bar within the price wave swing and creates a cumulative histogram
Pips: the indicator adds the bar distance from open to close and creates a cumulative histogram of the net pip movement of the price swing
Time: adds the time of each bar within the price wave swing and creates a cumulative histogram
Progressive Volume Rate (PVR): measures the volume rate within each wave (if volume is increasing or decreasing or staying steady as the wave progresses)
Emphasized Volume: the indicator adds the volume of each bar within the price wave swing and creates a cumulative histogram but contains an algorithm that emphasizes the large waves.
How to Use
Draw Support/Resistance and Fib - Monitor carefully the cumulative histograms at these levels. Usually supply and demand imbalance happens at this level.
First and most important of all adjust AutoSesnsitivity to get your swings correct. Getting the correct swings means waves are catching the tops and bottoms of each price wave swings.
Then identify potential trades by:
1. Comparison of cumulative Volume histogram vs Pip histogram which makes the concept of Wyckoff "Effort versus Result" identifiable, lot's of volume with small pip move = lot's of effort vs with small result. Supply and Demand imbalance.
2. Monitor Progressive Volume Rate histogram which measures if the volume rate is increasing, decreasing or remains steady within the price wave swing. This histogram indicates more or less participation as price increases or decreases within the specific wave. For example increase of volume rate as price goes up could mean more participation which could mean that sellers might be entering. Also the opposite is valid increasing volume rate as price goes down could mean that buyers are entering.
3. Emphasized Volume waves, provide a visual emphases on large volume waves only, useful for traders that like to trade with high volume trends and for traders that believe that in large volume waves large institutes participate. Trade with price trend but also with the volume trend concept.
What makes it unique
This indicator is an advance cumulative wave histogram because apart the regular volume histogram and apart form using each wave type individually to make a decision it provides more confidence and becomes more powerful when confluence is used combining the other wave types and by using the strategies mentioned above to a higher probability trade. Some examples are shown below
Example of Effort vs. Result Concept
Example of Progressive Volume Rate
Example of Emphasized Volume
發行說明
v1.1 Added Fine tune parameter to adjust wave lines better. Importance of getting the wave swings correct determines the success of the system. Value of 1 equals applies no change vs previous version increasing the number remove small waves. Example: Setting the AutoSensivity to a high value 10 or 11 will result to many small waves - increasing the Fine tune number will decrease unnecessary small waves.發行說明
v1.2- Altered algorithm of how Histogram is displayed
- Added bar value to be displayed in each bar
- Added border width and color options
- Added the option to display a Rectangle instead of a cumulative Histogram
- Added value to be displayed on Rectangle
Values displayed on each bar
Rectangles instead of Cumulative Histogram
發行說明
v1.3 Fixed a small bug on border width.
發行說明
v1.4New Waved Type added: IPPR (Inverse Progressive Pip Rate). This wave type identifies when price stalls (not moving) within the pip-wave. The higher the number the larger the stall. To make more visible scale the y-axis between 0.5-1.0
發行說明
Fixed chart no display when AutoSenitivity=11 and FineTune=1發行說明
v2.0Added calculations for the forming bar. Now cumulative histograms and Rectangles are drawn live on the last forming bar.
發行說明
v2.1Fixed a small divide by 0 bug
發行說明
v2.2 Improved Wave Swing Algorithm發行說明
v2.3Fix a bug of incorrect drawing the last waves.
發行說明
v2.4Fixed overlapping bars
發行說明
v2.5Added adjustable Border Histogram Color depending on wave Direction
發行說明
v3.0New wave swing methodologies Auto waves, Manual and ATR
On way sync for wave swing parameters from Weis Wave with Speed Index Signals to Wave Types
Display of swing methodology on char
僅限邀請腳本
僅作者批准的使用者才能訪問此腳本。您需要申請並獲得使用許可,通常需在付款後才能取得。更多詳情,請依照作者以下的指示操作,或直接聯絡TradeTheVolumeWaves。
TradingView不建議在未完全信任作者並了解其運作方式的情況下購買或使用腳本。您也可以在我們的社群腳本中找到免費的開源替代方案。
作者的說明
Pricing: https://www.tradethevolumewaves.com/plans-pricing
Please email: info@tradethevolumewaves.com to be informed about accessing this indicator. Detail manual, a setup video, trading strategies and 2 hours live training are available.
Contact:info@tradethevolumeswaves.com
Site: tradethevolumewaves.com
Lesson 15: youtu.be/QPG59GWr5HQ?si=joaRCJgvyo-L2ntM
Site: tradethevolumewaves.com
Lesson 15: youtu.be/QPG59GWr5HQ?si=joaRCJgvyo-L2ntM
免責聲明
這些資訊和出版物並非旨在提供,也不構成TradingView提供或認可的任何形式的財務、投資、交易或其他類型的建議或推薦。請閱讀使用條款以了解更多資訊。