OPEN-SOURCE SCRIPT
已更新 Key Levels (Daily Percentages)

OVERVIEW
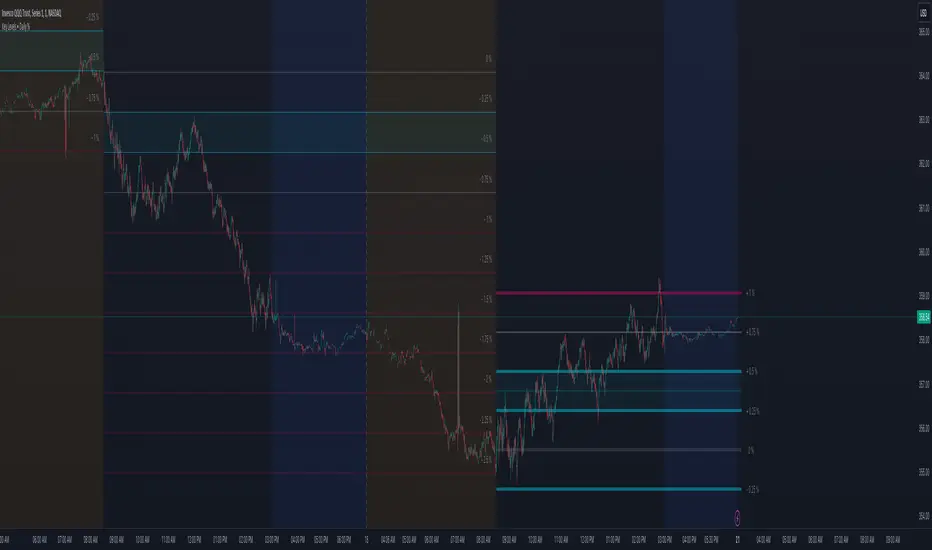
This indicator automatically identifies and progressively draws daily percentage levels, normalized to the first market bar.
Percentages are one of the most common ways to measure price movement (outside price itself). Being able to visually reference these levels helps contextualize price action, in addition to giving us a glimpse into how algos might "see" the market.
This script is most useful on charts with smaller time frames (1 to 5 minutes). This is not ideal for medium or larger time frames (greater than 5 minutes).
INPUTS
You can configure:
• Line size, style, colors and maximum length
• Label colors and visibility
• Fractional and intra level visibility
• Bidirectional zone parameters (custom range and extended anomalies)
• Normalization source
• Price Proximity features
• Market Hours and Time Zone
INSPIRATION
Broad Assumptions:
• +/- 70% of days move 1%, 20% of days move 1-2%, and 10% of days have moves exceeding 2%.
• +/- 10-20% of days trend, with moves ≥ 1%.
• All trading strategies are effectively scalping, mean reversion, or trend.
• Humans program algos to capitalize on these assumptions, using percentages to mange / execute trades.
發行說明
• Added script URL to top comment.發行說明
• Removed unnecessary var declarations to reduce performance penalties.發行說明
• Added ability to set the normalized source to be either Todays Open or Yesterdays Close.• Added Eighths as an incremental level option.
• Added ability to set the labels to be either Percentage, Basis Points, or Value Delta.
發行說明
• Added ability to set the normalized source to be Each New Session.• Added tooltips to display the value of each level when you hover over a given label.
• Added ability to set the normalized source interval to always 1 Minute regardless of the current charts interval, or always the Same Interval as Chart. Selecting 1 Minute will show the same zero / scale values regardless of timeframe, and selecting Same Interval as Chart will adjust the zero / scale values based on the charts timeframe.
發行說明
• Bug Fix: Yesterdays Close was referencing the close from 2 days ago. It now references the close from 1 day ago (aka. yesterday).發行說明
• Changed the default Time Zone from America/New_York to syminfo.timezone to make switching between securities that do not share time zones easier.發行說明
• Updated to support sub 1 minute timeframes.發行說明
- Added 1D Chart Open and Close as a Norm. Source option
- Removed support for seconds timeframes to simplify logic
- Other minor enhancements
- Converted to Pine Script v6
發行說明
- Bug fix
發行說明
- Incorporated Utility Library for shared logic across scripts.
- Other minor enhancements.
發行說明
- Updated `for` loops to make them compatible with the latest Pine Script changes affecting counter boundaries.
發行說明
- Improved logic for 1D Open and 1D Close on partial trading days.
- Other minor changes.
發行說明
- Extended Range of Proximity setting to also control how levels progressively display, and converted the input to be a percentage of the range, rather than a percentage of the level (more human friendly).
- Added ability to control ATR Zone length, size, and opacity.
- Other minor code simplifications.
開源腳本
秉持TradingView一貫精神,這個腳本的創作者將其設為開源,以便交易者檢視並驗證其功能。向作者致敬!您可以免費使用此腳本,但請注意,重新發佈代碼需遵守我們的社群規範。
Discord: discord.gg/bPAPhwUeud
Website: liquid-trader.com
Website: liquid-trader.com
免責聲明
這些資訊和出版物並非旨在提供,也不構成TradingView提供或認可的任何形式的財務、投資、交易或其他類型的建議或推薦。請閱讀使用條款以了解更多資訊。
開源腳本
秉持TradingView一貫精神,這個腳本的創作者將其設為開源,以便交易者檢視並驗證其功能。向作者致敬!您可以免費使用此腳本,但請注意,重新發佈代碼需遵守我們的社群規範。
Discord: discord.gg/bPAPhwUeud
Website: liquid-trader.com
Website: liquid-trader.com
免責聲明
這些資訊和出版物並非旨在提供,也不構成TradingView提供或認可的任何形式的財務、投資、交易或其他類型的建議或推薦。請閱讀使用條款以了解更多資訊。