OPEN-SOURCE SCRIPT
Action Trend Line
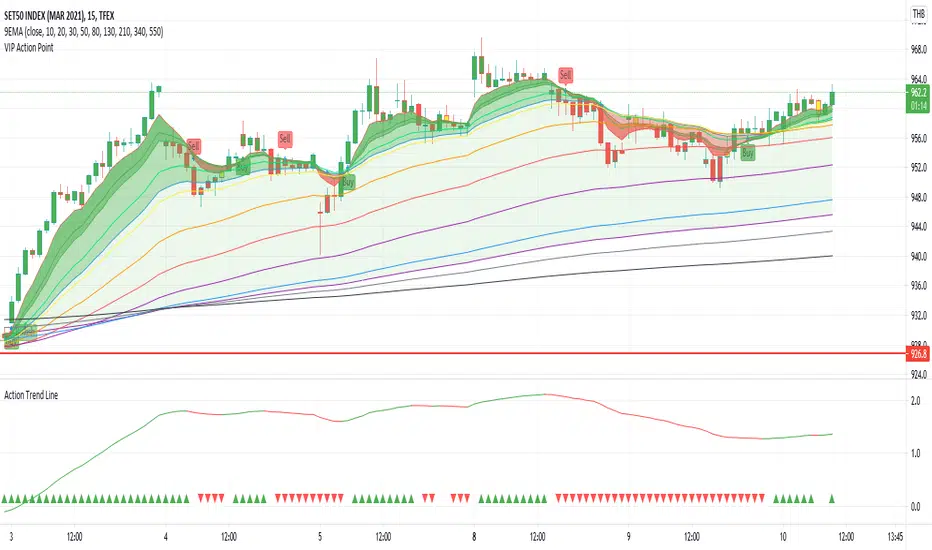
Action Trend Line is different of Moving Average between ema26 and ema260
My idea is, if ema26 drop to ema260 means downtrend
if ema26 increase or moving out of ema260 means uptrend
then writting a different line by 100 scale to be clear vision
at the bottom have plot sign up and down for each candle, it is status information
The chart show Action Trend Line, by 2 color and 2 sign at the bottom of chart.
If the line is growing up then color is green. you could know that is uptrend.
If the line is going down then color is red. you could know that is downtrend.
The triangle sign at the bottom of chart show trend folowing.
If previous and this line are uptrend, the triangle up and green color.
If previous and this line are downtrend, the triangle down and redcolor.
otherwise, the trend going to change it dosen't plot any sign, you cloud know warning the trend going to be change.
Must try and make you clearly understand.
開源腳本
本著TradingView的真正精神,此腳本的創建者將其開源,以便交易者可以查看和驗證其功能。向作者致敬!雖然您可以免費使用它,但請記住,重新發佈程式碼必須遵守我們的網站規則。
免責聲明
這些資訊和出版物並不意味著也不構成TradingView提供或認可的金融、投資、交易或其他類型的意見或建議。請在使用條款閱讀更多資訊。
開源腳本
本著TradingView的真正精神,此腳本的創建者將其開源,以便交易者可以查看和驗證其功能。向作者致敬!雖然您可以免費使用它,但請記住,重新發佈程式碼必須遵守我們的網站規則。
免責聲明
這些資訊和出版物並不意味著也不構成TradingView提供或認可的金融、投資、交易或其他類型的意見或建議。請在使用條款閱讀更多資訊。