OPEN-SOURCE SCRIPT
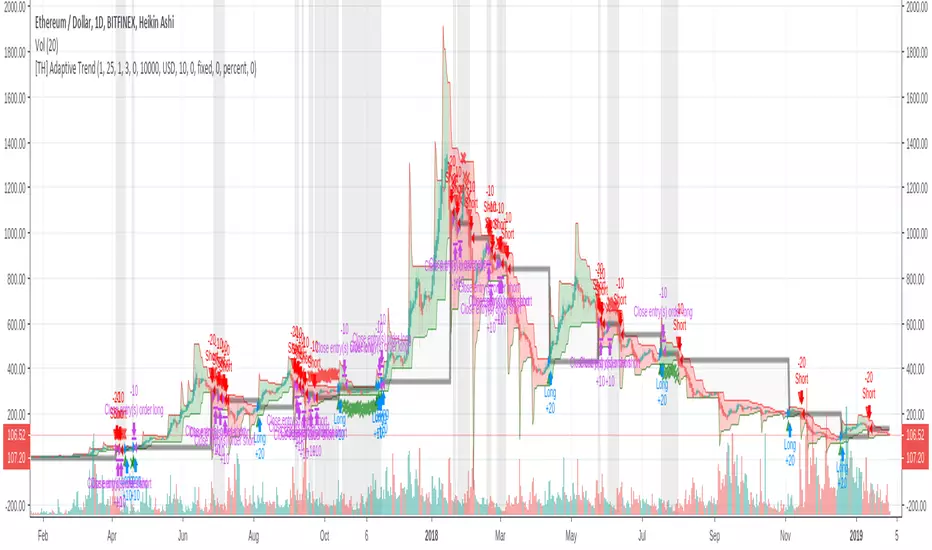
[TH] Adaptive Trend : Strategy

Adaptive Trend : Strategy
*** It should be used with 'heikin ashi' chart ***
*** It should be used with 'heikin ashi' chart ***
- Super Trend
Basically, it is super trend strategy ( Rajandran R Supertrend )
- My idea is,
1. (scale) Factor of super trend is related with sensitivity of Up/Down trend change
2. Constant Factor cause failure of super trend strategy when market prices variance is low ( ie. high Factor ==> miss short trend )
3. By using variance measure ( like BollingerBand ) as a varying Factor, maybe we can catch short trend and long trend together - Loss Cut
The silver thick line is loss cut line & silver background means exit position status
I found that silver background is appear usually when price moves horizontally
1. It is set to open price of actual position entry ( heikin ashi chart's open price = loss cut line = (open + close)/2 )
2. If position is long
==> loss cut is executed when low price is lower than loss cut line
==> re-entry when low price is higher than loss cut line
3. If Position is short
==> loss cut is executed when high price is higher than loss cut line
==> re-entry when high price is lower than loss cut lin
開源腳本
秉持TradingView一貫精神,這個腳本的創作者將其設為開源,以便交易者檢視並驗證其功能。向作者致敬!您可以免費使用此腳本,但請注意,重新發佈代碼需遵守我們的社群規範。
免責聲明
這些資訊和出版物並非旨在提供,也不構成TradingView提供或認可的任何形式的財務、投資、交易或其他類型的建議或推薦。請閱讀使用條款以了解更多資訊。
開源腳本
秉持TradingView一貫精神,這個腳本的創作者將其設為開源,以便交易者檢視並驗證其功能。向作者致敬!您可以免費使用此腳本,但請注意,重新發佈代碼需遵守我們的社群規範。
免責聲明
這些資訊和出版物並非旨在提供,也不構成TradingView提供或認可的任何形式的財務、投資、交易或其他類型的建議或推薦。請閱讀使用條款以了解更多資訊。