INVITE-ONLY SCRIPT
HL MAs
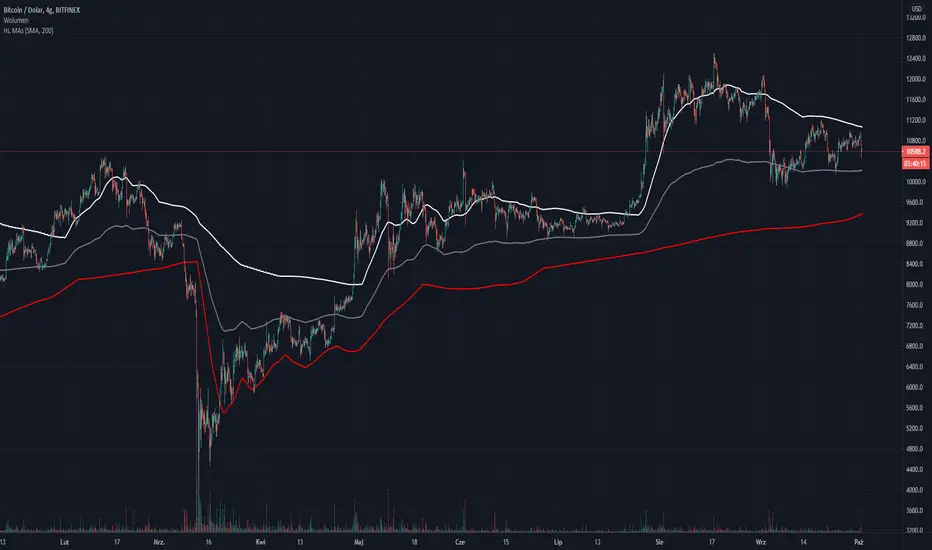
Main features of this script are:
* To show always highest and lowest value from given Moving Averages of certain intervals (30min, 1h, 2h, 4h. 6h, 12h, 1D, 3D, 1W to choose from, multiple choices are possible and desired).
* It also draws the middle line made of highest and lowest MA lines.
* If you would like to see all the MAs to see how its working you can turn them on from the scripts options ("Show all MAs").
* You may switch between SMA and EMA.
* You may set the length of which MAs on all set intervals will be calculated.
* The plus of using this is also that no matter what interval you have on chart, you will always see MAs from set up intervals, so lines will be always in the same places on chart.
ps. This script is invite-only for the members of our trading group (info in signature, group is free of charge).
僅限邀請腳本
只有經作者批准的使用者才能訪問此腳本。您需要申請並獲得使用權限。該權限通常在付款後授予。如欲了解更多詳情,請依照以下作者的說明操作,或直接聯絡hiddenpablo。
除非您完全信任其作者並了解腳本的工作原理,否則TradingView不建議您付費或使用腳本。您也可以在我們的社群腳本中找到免費的開源替代方案。
作者的說明
We are group of mostly Polish traders but welcome everyone to join our Discord crypto&fx group: ChartInsiders.com
- discord.gg/HyzyrtnpP3
My Twitter Account: twitter.com/Crypto_Investor
- discord.gg/HyzyrtnpP3
My Twitter Account: twitter.com/Crypto_Investor
免責聲明
這些資訊和出版物並不意味著也不構成TradingView提供或認可的金融、投資、交易或其他類型的意見或建議。請在使用條款閱讀更多資訊。