OPEN-SOURCE SCRIPT
Tycoon Gann
Currently this script will work for the stocks and futures price trading in between 1000 - 100000. In our future update we will add another feature that will give you access to all the price digit stocks futures and currencies too .
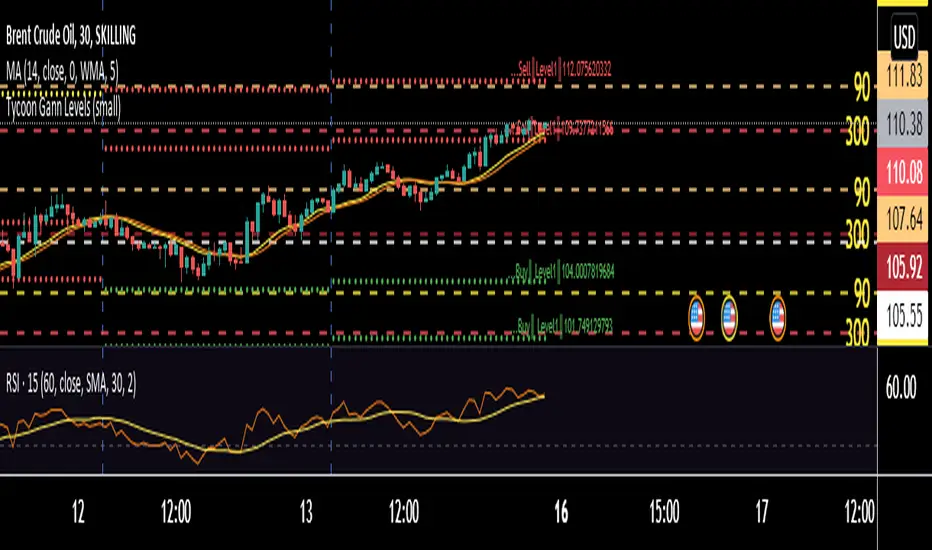
This is purely based on a secret method of Tycoon Infotek as a research of GANN levels we found in our experience these WD GANN Trend angle based calculations giving us some important hints to watch . Degree offset from previous close price add 90 degree to calculate resistance and substract 90 to get resistance levels . green color dots denotes buying pressure zone and red color denotes selling pressure zones . yellow line indicates neutral sign
These levels not only shows us the Support and resistance . It clearly intimate us the strength of selling and buying pressure naturally occurred once the price reaches the zones.
開源腳本
秉持TradingView一貫精神,這個腳本的創作者將其設為開源,以便交易者檢視並驗證其功能。向作者致敬!您可以免費使用此腳本,但請注意,重新發佈代碼需遵守我們的社群規範。
免責聲明
這些資訊和出版物並非旨在提供,也不構成TradingView提供或認可的任何形式的財務、投資、交易或其他類型的建議或推薦。請閱讀使用條款以了解更多資訊。
開源腳本
秉持TradingView一貫精神,這個腳本的創作者將其設為開源,以便交易者檢視並驗證其功能。向作者致敬!您可以免費使用此腳本,但請注意,重新發佈代碼需遵守我們的社群規範。
免責聲明
這些資訊和出版物並非旨在提供,也不構成TradingView提供或認可的任何形式的財務、投資、交易或其他類型的建議或推薦。請閱讀使用條款以了解更多資訊。