INVITE-ONLY SCRIPT
Crowd Tracker (work in progress)
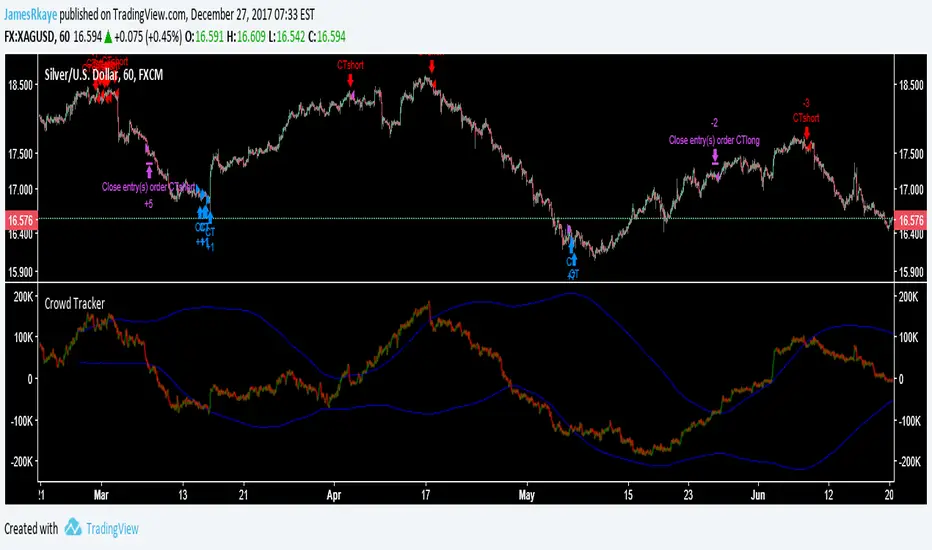
This indicator/strategy should be used similarly to how you would analyse sentiment data, when the crowd is bullish look to be short, when the crowd is bearish look to be long. It is also is inspired by Elliott wave, as it is looking for ending waves. The crowd tracker uses volume and price data to estimate how many people went long or short in a candle, then adds the candles over a 500 candle period together. A spike in bullishness on the indicator indicates that a bull trend may be over because ending Elliott waves, for example 5s and Cs, are when the crowd are most on board with the trend. The blue lines are a standard deviation (Bollinger Band), between these lines is where a healthy trend would be found. When the Crowd Tracker leaves and re-enters the blue lines this is a sign of a change in trader psychology, as they have reached their maximum confidence in a trend then reversed.
This is still work in progress because I want to find a better way to find the tops and bottoms of the Crowd Tracker, so it is set to invite only, after I have completed it I will probably release it in protected so follow me if you want to use it later on :) It is good at spotting entries for cryptos and stock indexes however the exits still need work.
This is still work in progress because I want to find a better way to find the tops and bottoms of the Crowd Tracker, so it is set to invite only, after I have completed it I will probably release it in protected so follow me if you want to use it later on :) It is good at spotting entries for cryptos and stock indexes however the exits still need work.
僅限邀請腳本
僅作者批准的使用者才能訪問此腳本。您需要申請並獲得使用許可,通常需在付款後才能取得。更多詳情,請依照作者以下的指示操作,或直接聯絡JamesRkaye。
TradingView不建議在未完全信任作者並了解其運作方式的情況下購買或使用腳本。您也可以在我們的社群腳本中找到免費的開源替代方案。
作者的說明
免責聲明
這些資訊和出版物並非旨在提供,也不構成TradingView提供或認可的任何形式的財務、投資、交易或其他類型的建議或推薦。請閱讀使用條款以了解更多資訊。
僅限邀請腳本
僅作者批准的使用者才能訪問此腳本。您需要申請並獲得使用許可,通常需在付款後才能取得。更多詳情,請依照作者以下的指示操作,或直接聯絡JamesRkaye。
TradingView不建議在未完全信任作者並了解其運作方式的情況下購買或使用腳本。您也可以在我們的社群腳本中找到免費的開源替代方案。
作者的說明
免責聲明
這些資訊和出版物並非旨在提供,也不構成TradingView提供或認可的任何形式的財務、投資、交易或其他類型的建議或推薦。請閱讀使用條款以了解更多資訊。