OPEN-SOURCE SCRIPT
已更新 Quarterly Earnings
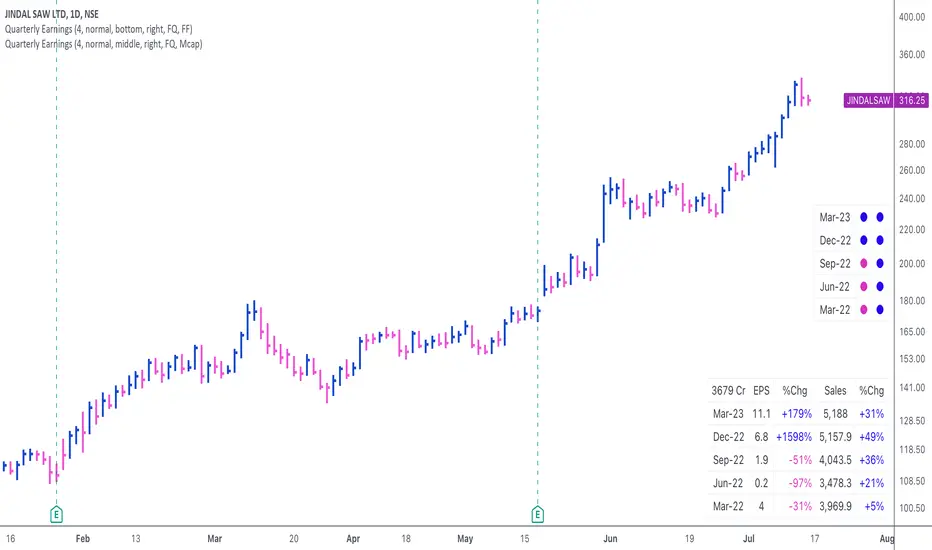
This script displays quarterly earnings per share (EPS) and sales data, and their year-on-year percentage change.
The script builds upon the Volume Price and Fundamentals script by Mohit_Kakkar08 and improves upon the array functions to keep the code light-weight & the output as accurate as possible. This script uses diluted EPS data for calculating the quarterly earnings. New quarters are auto-generated by the script as the earnings data gets updated in Tradingview every quarter.

Features:
⦿ View quarterly earnings per share (EPS) and sales data.
⦿ The percentage change is a YoY (year on year) comparison of the current quarter to the same quarter of the previous year.
⦿ Option to change the data from Quarterly (FQ) to Yearly (FY).
⦿ Long mode: Option to increase the number of previous quarters displayed in the table (default is the past 4 quarters) to any number.
⦿ Location & size of the table can be changed.
⦿ Option for a 1-click dark mode
⦿ Option for a 'Mini mode' where the values are replaced by traffic lights for a quick visual:
🟢 or 🔵 YoY increase in earnings/sales
🔴 or 🟣 YoY decrease in earnings/sales
🟡 or 🟠 YoY earnings/sales unchanged
⚪️ No data available
⦿ The top-left cell has the option to display either the free float (FF) or the marketcap (Mcap) of the stock.
Please note that sometimes the Tradingview data reflected in the script output might differ a bit from MarketSmith. Also make sure you are viewing the 'consolidated' data there.
This script was developed as a collaboration between me & @EquityCraze.
The script builds upon the Volume Price and Fundamentals script by Mohit_Kakkar08 and improves upon the array functions to keep the code light-weight & the output as accurate as possible. This script uses diluted EPS data for calculating the quarterly earnings. New quarters are auto-generated by the script as the earnings data gets updated in Tradingview every quarter.
Features:
⦿ View quarterly earnings per share (EPS) and sales data.
⦿ The percentage change is a YoY (year on year) comparison of the current quarter to the same quarter of the previous year.
⦿ Option to change the data from Quarterly (FQ) to Yearly (FY).
⦿ Long mode: Option to increase the number of previous quarters displayed in the table (default is the past 4 quarters) to any number.
⦿ Location & size of the table can be changed.
⦿ Option for a 1-click dark mode
⦿ Option for a 'Mini mode' where the values are replaced by traffic lights for a quick visual:
🟢 or 🔵 YoY increase in earnings/sales
🔴 or 🟣 YoY decrease in earnings/sales
🟡 or 🟠 YoY earnings/sales unchanged
⚪️ No data available
⦿ The top-left cell has the option to display either the free float (FF) or the marketcap (Mcap) of the stock.
Please note that sometimes the Tradingview data reflected in the script output might differ a bit from MarketSmith. Also make sure you are viewing the 'consolidated' data there.
This script was developed as a collaboration between me & @EquityCraze.
發行說明
This update fixes an error in the % change calculation in the FY mode.發行說明
This update improves the % change calculation when the previous year quarter had 0 EPS.發行說明
Updated to resolve an error in the calculation of some % changes due to handling of 0 EPS.開源腳本
秉持TradingView一貫精神,這個腳本的創作者將其設為開源,以便交易者檢視並驗證其功能。向作者致敬!您可以免費使用此腳本,但請注意,重新發佈代碼需遵守我們的社群規範。
免責聲明
這些資訊和出版物並非旨在提供,也不構成TradingView提供或認可的任何形式的財務、投資、交易或其他類型的建議或推薦。請閱讀使用條款以了解更多資訊。
開源腳本
秉持TradingView一貫精神,這個腳本的創作者將其設為開源,以便交易者檢視並驗證其功能。向作者致敬!您可以免費使用此腳本,但請注意,重新發佈代碼需遵守我們的社群規範。
免責聲明
這些資訊和出版物並非旨在提供,也不構成TradingView提供或認可的任何形式的財務、投資、交易或其他類型的建議或推薦。請閱讀使用條款以了解更多資訊。