OPEN-SOURCE SCRIPT
Average True Range Overlay
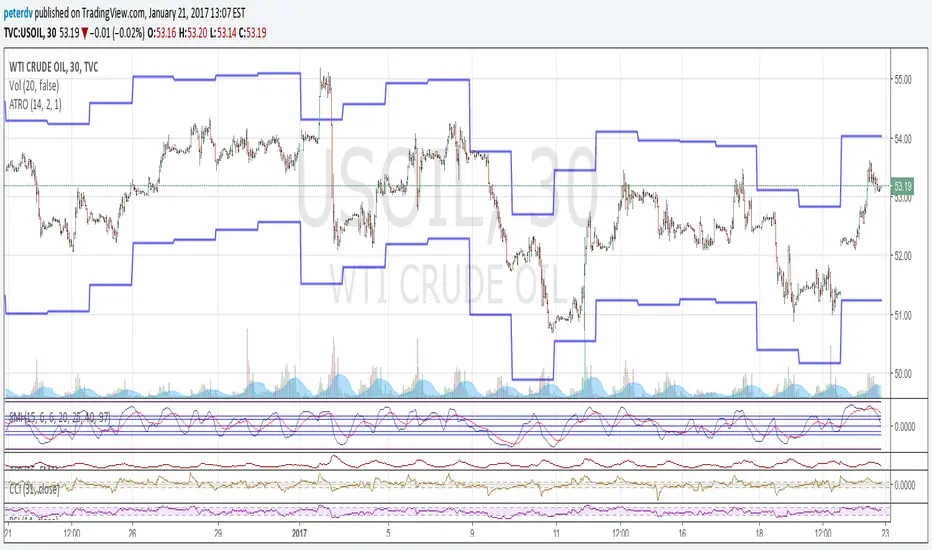
Plots ATR calculated on a daily basis as an overlay on the current chart.
Implemented using the builtin atr function.
ATR is a volatility indicator
originally developed by J. Welles Wilder, Jr. for commodities:
New Concepts in Technical Trading Systems. Greensboro, NC: Trend Research. ISBN 978-0-89459-027-6.
The range of a day's trading is simply R = high − low.
The true range extends it to yesterday's closing price if it was outside of today's range:
TR = max[(high-low), abs(high-close(previous)), abs(low - close(previous))]
The average true range is an N-day smoothed moving average of the TR values.
A first stab at a sensible stop loss level might be 3*ATR below recent peak.
開源腳本
秉持TradingView一貫精神,這個腳本的創作者將其設為開源,以便交易者檢視並驗證其功能。向作者致敬!您可以免費使用此腳本,但請注意,重新發佈代碼需遵守我們的社群規範。
免責聲明
這些資訊和出版物並非旨在提供,也不構成TradingView提供或認可的任何形式的財務、投資、交易或其他類型的建議或推薦。請閱讀使用條款以了解更多資訊。
免責聲明
這些資訊和出版物並非旨在提供,也不構成TradingView提供或認可的任何形式的財務、投資、交易或其他類型的建議或推薦。請閱讀使用條款以了解更多資訊。