OPEN-SOURCE SCRIPT
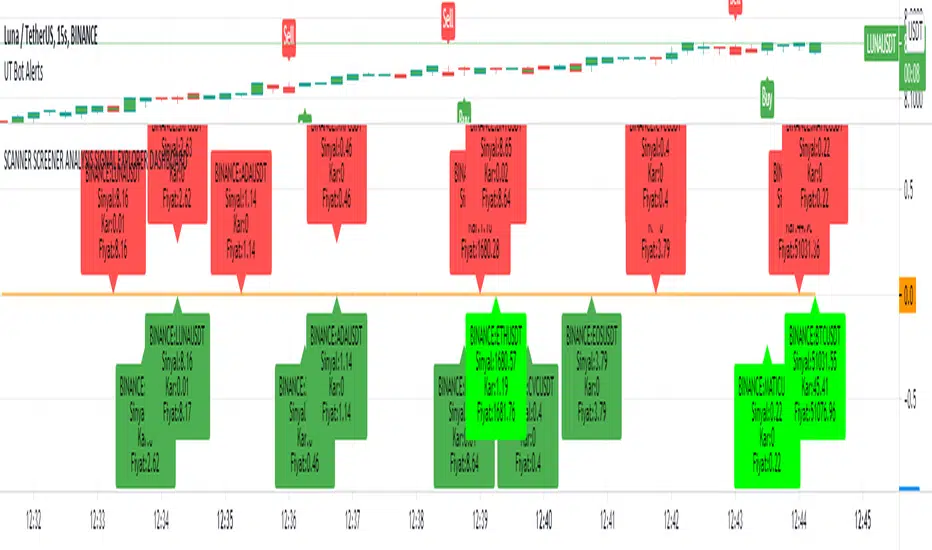
已更新 SCANNER SCREENER ANALYSIS SIGNAL EXPLORER DASHBOARD

New Buy signal: light green color
New Sell signal: light red color
Bullish dark green condition
Brearish dark red condition
Set your trend strategy in settings.
You can watch 20 pair in one indicator. Add more indicator panel and move same window and watch more signals in the same window. Set X axis cordinates 0-25-50-75-100-125-150-175-200 etc.for not overlap
You can add your favorite stocks, fx, crypto and analys for buy and sell signal.
When change the time frame new signal show on your selected time frame
it shows profit and signal price.
Look and review my other amazing indicator. It is best on TVs.
For Access and try my other best quality indicators till 7 days, message me. You can monthly subscribe my scripts my google play app on my profile or sent (30 USD) btc my bitcoin adress.
發行說明
visual updates發行說明
fixed error and condition sets Ut Bot 開源腳本
秉持TradingView一貫精神,這個腳本的創作者將其設為開源,以便交易者檢視並驗證其功能。向作者致敬!您可以免費使用此腳本,但請注意,重新發佈代碼需遵守我們的社群規範。
Next generation technical analysis. Challenge the markets!
Join my telegram channel t.me/strategiest
Join my telegram channel t.me/strategiest
免責聲明
這些資訊和出版物並非旨在提供,也不構成TradingView提供或認可的任何形式的財務、投資、交易或其他類型的建議或推薦。請閱讀使用條款以了解更多資訊。
開源腳本
秉持TradingView一貫精神,這個腳本的創作者將其設為開源,以便交易者檢視並驗證其功能。向作者致敬!您可以免費使用此腳本,但請注意,重新發佈代碼需遵守我們的社群規範。
Next generation technical analysis. Challenge the markets!
Join my telegram channel t.me/strategiest
Join my telegram channel t.me/strategiest
免責聲明
這些資訊和出版物並非旨在提供,也不構成TradingView提供或認可的任何形式的財務、投資、交易或其他類型的建議或推薦。請閱讀使用條款以了解更多資訊。