OPEN-SOURCE SCRIPT
EMA Channel Key K-Lines
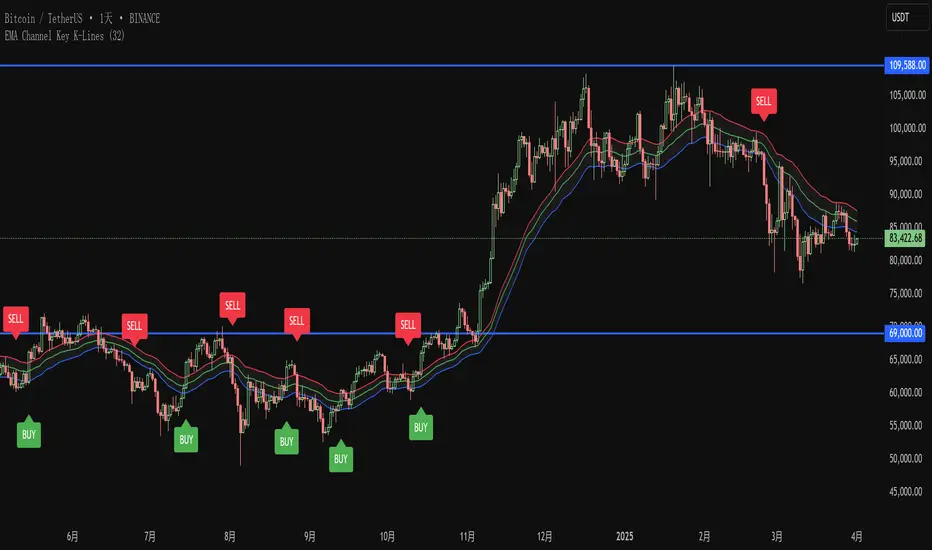
EMA Channel Setup:
Key K-line Identification:
Visual Markers:
Logic Flow:
- Three 32-period EMAs (high, low, close prices)
- Visually distinct colors (red, blue, green)
- Gray background between high and low EMAs
Key K-line Identification:
- For buy signals: Close > highest EMA, K-line height ≥ channel height, body ≥ 2/3 of range
- For sell signals: Close < lowest EMA, K-line height ≥ channel height, body ≥ 2/3 of range
- Alternating signals only (no consecutive buy/sell signals)
Visual Markers:
- Green "BUY" labels below key buy K-lines
- Red "SELL" labels above key sell K-lines
- Clear channel visualization
Logic Flow:
- Tracks last signal direction to prevent consecutive same-type signals
- Strict conditions ensure only significant breakouts are marked
- All calculations based on your exact specifications
開源腳本
秉持TradingView一貫精神,這個腳本的創作者將其設為開源,以便交易者檢視並驗證其功能。向作者致敬!您可以免費使用此腳本,但請注意,重新發佈代碼需遵守我們的社群規範。
免責聲明
這些資訊和出版物並非旨在提供,也不構成TradingView提供或認可的任何形式的財務、投資、交易或其他類型的建議或推薦。請閱讀使用條款以了解更多資訊。
免責聲明
這些資訊和出版物並非旨在提供,也不構成TradingView提供或認可的任何形式的財務、投資、交易或其他類型的建議或推薦。請閱讀使用條款以了解更多資訊。