OPEN-SOURCE SCRIPT
Doji Double Top & Double Bottom
- FUNCTION :
This indicator checks if 2 consecutive candlesticks are formed in such a way that both the lows or both the highs of the consecutive candlesticks are almost at the same level and either of them is a doji - TIMEFRAMES :
it works on daily, weekly, monthly and higher timeframes - CRITERIA :
- There is maximum difference value between 2 consecutive candlesticks' lows or 2 consecutive candlesticks' highs
- Minimum value of the doji's wick size
- Maximum value of the doji's body size
These 3 conditions need to be fulfilled for the 2 consecutive candlesticks to be considered as a Double top or Double bottom by this indicator- EXAMPLES :
Here the indicator is giving only double Bottom signals on CRUDE OIL chart
Here the indicator is giving only double top signals on GOLD chart
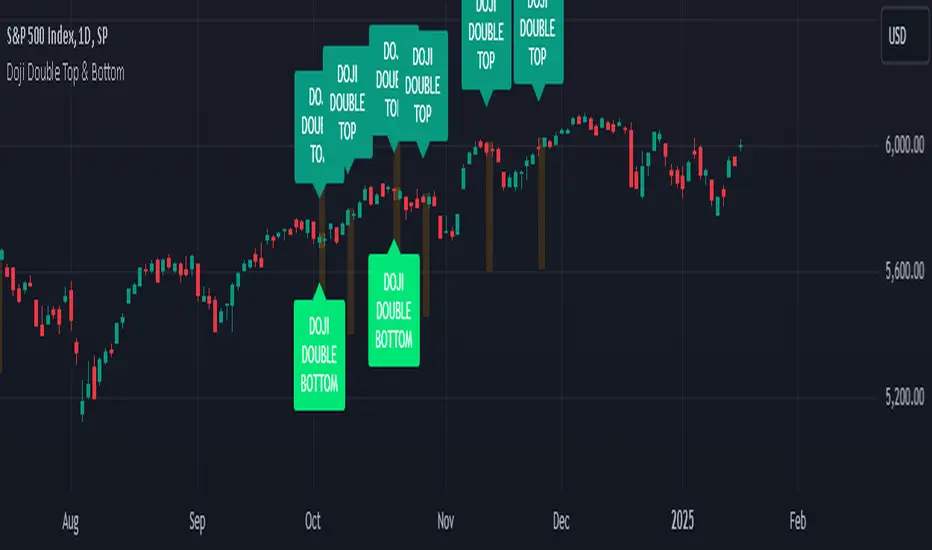
Here the indicator gives both double top & double bottom signals on EUR/USD Daily chart
Here the indicator is giving both double top & double bottom signals on EUR/USD Half-Yearly chart - DEFINITIONS :
There are 2 types -
- DOJI DOUBLE BOTTOM - if the lows of 2 consecutive candlesticks are almost at the same level & either of them is doji then it is called Double Bottom and market is supposed to go higher after forming it.
- DOJI DOUBLE TOP - if the highs of 2 consecutive candlesticks are almost at the same level & either of them is doji then it is called Double Top and market is supposed to go lower after forming it.
- SETTINGS :
There are options to change the value of each of the 3 parameters within the indicator's settings for daily, weekly & monthly chart[ - LIMITATIONS :
You should not trade based on the signals from this indicator solely, you should check other parameters too before making trading decision
- EXAMPLES :
開源腳本
秉持TradingView一貫精神,這個腳本的創作者將其設為開源,以便交易者檢視並驗證其功能。向作者致敬!您可以免費使用此腳本,但請注意,重新發佈代碼需遵守我們的社群規範。
My Social Media links :
📥 Instagram - instagram.com/sagar_trademaster/
📥 Youtube - youtube.com/@TruthfulTrader
📥 Instagram - instagram.com/sagar_trademaster/
📥 Youtube - youtube.com/@TruthfulTrader
免責聲明
這些資訊和出版物並非旨在提供,也不構成TradingView提供或認可的任何形式的財務、投資、交易或其他類型的建議或推薦。請閱讀使用條款以了解更多資訊。