INVITE-ONLY SCRIPT
CandelaCharts - Contango Slope Index
📝 Overview
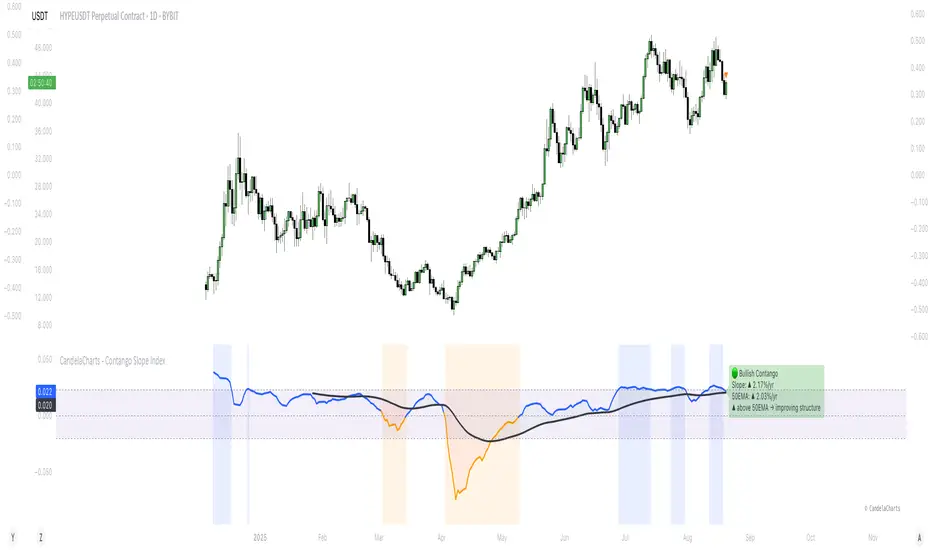
The Contango Slope Index (CSI) is a volatility term structure analysis tool designed to quantify the slope of the VIX futures curve over time.
By measuring the rate of change in implied volatility across multiple tenors—such as VIX1D, VIX (1M), VIX3M, VIX6M, and VIX1Y—the CSI provides traders and analysts with real-time insights into market sentiment, risk appetite, and potential turning points in equity markets.
Developed by CandelaCharts, the CSI draws from established financial research on volatility term structures, particularly focusing on how contango (upward-sloping curve) and backwardation (downward-sloping curve) regimes correlate with future market behavior.
The index computes a normalized slope using linear regression across available VIX futures, offering a dynamic view of evolving market expectations. The core output a slope value expressed in annualized percentage points per year (%/yr)—represents the steepness of the volatility curve:
📦 Features
The Contango Slope Index offers a comprehensive set of features for analyzing volatility dynamics:
⚙️ Settings
⚡️ Showcase
Slope Line

Customizable Moving Average

Regime Shift Zones

📒 Usage
The CSI is plotted as a standalone oscillator beneath the price chart (non-overlay mode). Key interpretation guidelines:
Slope Direction
Magnitude of Slope
Slope vs. MA Crossover
🚨 Alerts
Six pre-configured alerts are available for integration into trading systems:
⚠️ Disclaimer
These tools are exclusively available on the TradingView platform.
Our charting tools are intended solely for informational and educational purposes and should not be regarded as financial, investment, or trading advice. They are not designed to predict market movements or offer specific recommendations. Users should be aware that past performance is not indicative of future results and should not rely on these tools for financial decisions. By using these charting tools, the purchaser agrees that the seller and creator hold no responsibility for any decisions made based on information provided by the tools. The purchaser assumes full responsibility and liability for any actions taken and their consequences, including potential financial losses or investment outcomes that may result from the use of these products.
By purchasing, the customer acknowledges and accepts that neither the seller nor the creator is liable for any undesired outcomes stemming from the development, sale, or use of these products. Additionally, the purchaser agrees to indemnify the seller from any liability. If invited through the Friends and Family Program, the purchaser understands that any provided discount code applies only to the initial purchase of Candela's subscription. The purchaser is responsible for canceling or requesting cancellation of their subscription if they choose not to continue at the full retail price. In the event the purchaser no longer wishes to use the products, they must unsubscribe from the membership service, if applicable.
We do not offer reimbursements, refunds, or chargebacks. Once these Terms are accepted at the time of purchase, no reimbursements, refunds, or chargebacks will be issued under any circumstances.
By continuing to use these charting tools, the user confirms their understanding and acceptance of these Terms as outlined in this disclaimer.
The Contango Slope Index (CSI) is a volatility term structure analysis tool designed to quantify the slope of the VIX futures curve over time.
By measuring the rate of change in implied volatility across multiple tenors—such as VIX1D, VIX (1M), VIX3M, VIX6M, and VIX1Y—the CSI provides traders and analysts with real-time insights into market sentiment, risk appetite, and potential turning points in equity markets.
Developed by CandelaCharts, the CSI draws from established financial research on volatility term structures, particularly focusing on how contango (upward-sloping curve) and backwardation (downward-sloping curve) regimes correlate with future market behavior.
The index computes a normalized slope using linear regression across available VIX futures, offering a dynamic view of evolving market expectations. The core output a slope value expressed in annualized percentage points per year (%/yr)—represents the steepness of the volatility curve:
- Positive slope: Contango regime, typically associated with market stability and complacency.
- Negative slope: Backwardation, historically linked to fear, near-term uncertainty, and often preceding market rallies.
- Slope crossing zero or key thresholds: Generates regime shifts and alert conditions.
📦 Features
The Contango Slope Index offers a comprehensive set of features for analyzing volatility dynamics:
- Multi-Tenor Volatility Input: Users can select which VIX futures contracts to include in the slope calculation: VIX, VIX1D, etc
- Dynamic Slope Calculation: The indicator calculates the slope of the VIX term structure using linear regression on time-to-maturity (TTM) vs. volatility levels.
- Moving Average Overlay: A configurable moving average (SMA, EMA, RMA, WMA, VWMA) is applied to the smoothed slope to identify trend direction and momentum shifts.
- Regime Classification: Based on the slope value and its relationship to the moving average, the CSI classifies current market conditions into distinct regimes.
- Visual Enhancements: Color-coded slope line, background shading, etc
- Real-Time Label & Tooltip: On the last bar, a dynamic label displays: Current regime, Slope value and direction, etc
⚙️ Settings
- VIX: Toggles use of spot VIX index (CBOE_DLY:VIX).
- VIX1D: Toggles use of 1-day VIX futures (CBOE_DLY:VIX1D).
- VIX3M: Toggles use of 3-month VIX futures (CBOE_DLY:VIX3M).
- VIX6M: Toggles use of 6-month VIX futures (CBOE_DLY:VIX6M).
- VIX1Y: Toggles use of 1-year VIX futures (CBOE_DLY:VIX1Y).
- MA: Enables moving average filter; options include type (SMA, etc.) and period length.
- Slope: Defines slope calculation line thickness and colors.
- Bg: Enables background shading with customizable colors.
⚡️ Showcase
Slope Line
Customizable Moving Average
Regime Shift Zones
📒 Usage
The CSI is plotted as a standalone oscillator beneath the price chart (non-overlay mode). Key interpretation guidelines:
Slope Direction
- Slope < 0 - Backwardation: Indicates near-term volatility is higher than long-term expectations. Historically, this has preceded equity market rallies, as panic subsides and fear peaks.
- Slope > 0 - Contango: Reflects normal market conditions where longer-dated volatility is priced higher. Persistent high contango may signal complacency.
Magnitude of Slope
- Slope > 0.0232 (%/yr) - Elevated complacency: The term structure is steeper than historical average—caution advised ahead of potential corrections.
- Slope near 0 - Neutral or transitioning regime: Markets may be at inflection points.
Slope vs. MA Crossover
- Slope crosses above MA: Improving confidence, potential upside acceleration
- Slope crosses below MA: Deteriorating structure, rising stress
🚨 Alerts
Six pre-configured alerts are available for integration into trading systems:
- 🚨 Backwardation Detected – Slope turns negative
- 🔚 Exit Backwardation – Slope crosses above zero
- ⚠️ Elevated Complacency – Slope exceeds 2.32%/yr
- 📈 Potential Bullish Setup – Slope crosses below zero
- ✅ Slope Crosses Above MA – Momentum improves
- ⚠️ Slope Crosses Below MA – Momentum deteriorates
⚠️ Disclaimer
These tools are exclusively available on the TradingView platform.
Our charting tools are intended solely for informational and educational purposes and should not be regarded as financial, investment, or trading advice. They are not designed to predict market movements or offer specific recommendations. Users should be aware that past performance is not indicative of future results and should not rely on these tools for financial decisions. By using these charting tools, the purchaser agrees that the seller and creator hold no responsibility for any decisions made based on information provided by the tools. The purchaser assumes full responsibility and liability for any actions taken and their consequences, including potential financial losses or investment outcomes that may result from the use of these products.
By purchasing, the customer acknowledges and accepts that neither the seller nor the creator is liable for any undesired outcomes stemming from the development, sale, or use of these products. Additionally, the purchaser agrees to indemnify the seller from any liability. If invited through the Friends and Family Program, the purchaser understands that any provided discount code applies only to the initial purchase of Candela's subscription. The purchaser is responsible for canceling or requesting cancellation of their subscription if they choose not to continue at the full retail price. In the event the purchaser no longer wishes to use the products, they must unsubscribe from the membership service, if applicable.
We do not offer reimbursements, refunds, or chargebacks. Once these Terms are accepted at the time of purchase, no reimbursements, refunds, or chargebacks will be issued under any circumstances.
By continuing to use these charting tools, the user confirms their understanding and acceptance of these Terms as outlined in this disclaimer.
僅限邀請腳本
僅作者批准的使用者才能訪問此腳本。您需要申請並獲得使用許可,通常需在付款後才能取得。更多詳情,請依照作者以下的指示操作,或直接聯絡CandelaCharts。
TradingView不建議在未完全信任作者並了解其運作方式的情況下購買或使用腳本。您也可以在我們的社群腳本中找到免費的開源替代方案。
作者的說明
Explore all CandelaCharts indicators at: https://www.candelacharts.com/. Connect with our community on Discord: https://discord.gg/etGSTepqbu. All scripts and content provided by CandelaCharts are intended for informational and educational purposes only.
Get access to our exclusive tools: candelacharts.com
Join our community: discord.gg/etGSTepqbu
All content provided by CandelaCharts is for informational & educational purposes only.
Join our community: discord.gg/etGSTepqbu
All content provided by CandelaCharts is for informational & educational purposes only.
免責聲明
這些資訊和出版物並非旨在提供,也不構成TradingView提供或認可的任何形式的財務、投資、交易或其他類型的建議或推薦。請閱讀使用條款以了解更多資訊。