PROTECTED SOURCE SCRIPT
US Treasury Spot-Futures Price Differential
Basis Trade Analyzer: US Treasury Spot vs Futures Price Differential
Description:
This advanced indicator calculates and visualizes the price difference between US Treasury notes/bonds in the spot market versus their corresponding futures contracts. It's designed for traders who specialize in basis trading and cash-and-carry arbitrage strategies.
Key Features:
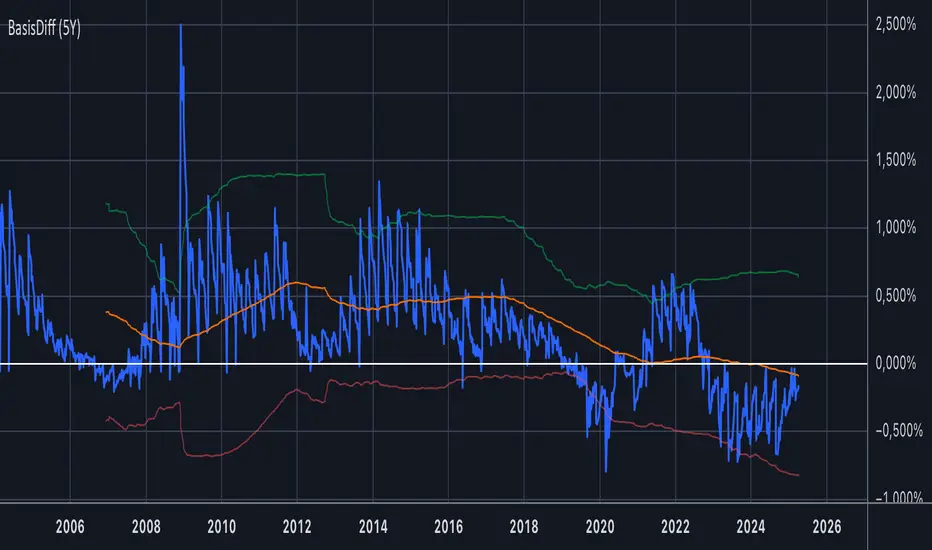
Calculates real-time price differential (basis) between spot and futures for 2Y, 5Y, and 10Y Treasuries
Displays the basis in both price points and basis points (bps)
Visualizes 200-day moving average and ±2 standard deviation bands
Includes comprehensive data table with:
Current spot and futures prices
Price differential and historical average
Volatility measurements
Built-in alerts for statistically significant deviations
Supported Instruments:
Spot: USB02YUSD (2Y), USB05YUSD (5Y), USB10YUSD (10Y)
Futures: ZT1! (2Y), ZF1! (5Y), ZN1! (10Y)
Usage Instructions:
Select the Treasury maturity (2Y/5Y/10Y) from the input menu
Monitor the blue line for current basis
Watch for mean-reversion opportunities when price approaches the bands
Use the data table for quick reference to key metrics
Professional Applications:
Identify cash-and-carry arbitrage opportunities
Monitor convergence trends as contracts approach delivery
Analyze historical basis volatility patterns
Develop relative value trading strategies
Note: The indicator uses direct price comparisons (not yields) for accurate basis calculations. For optimal results, use daily or weekly timeframes.
Description:
This advanced indicator calculates and visualizes the price difference between US Treasury notes/bonds in the spot market versus their corresponding futures contracts. It's designed for traders who specialize in basis trading and cash-and-carry arbitrage strategies.
Key Features:
Calculates real-time price differential (basis) between spot and futures for 2Y, 5Y, and 10Y Treasuries
Displays the basis in both price points and basis points (bps)
Visualizes 200-day moving average and ±2 standard deviation bands
Includes comprehensive data table with:
Current spot and futures prices
Price differential and historical average
Volatility measurements
Built-in alerts for statistically significant deviations
Supported Instruments:
Spot: USB02YUSD (2Y), USB05YUSD (5Y), USB10YUSD (10Y)
Futures: ZT1! (2Y), ZF1! (5Y), ZN1! (10Y)
Usage Instructions:
Select the Treasury maturity (2Y/5Y/10Y) from the input menu
Monitor the blue line for current basis
Watch for mean-reversion opportunities when price approaches the bands
Use the data table for quick reference to key metrics
Professional Applications:
Identify cash-and-carry arbitrage opportunities
Monitor convergence trends as contracts approach delivery
Analyze historical basis volatility patterns
Develop relative value trading strategies
Note: The indicator uses direct price comparisons (not yields) for accurate basis calculations. For optimal results, use daily or weekly timeframes.
受保護腳本
此腳本以閉源形式發佈。 不過,您可以自由使用,沒有任何限制 — 點擊此處了解更多。
免責聲明
這些資訊和出版物並非旨在提供,也不構成TradingView提供或認可的任何形式的財務、投資、交易或其他類型的建議或推薦。請閱讀使用條款以了解更多資訊。
受保護腳本
此腳本以閉源形式發佈。 不過,您可以自由使用,沒有任何限制 — 點擊此處了解更多。
免責聲明
這些資訊和出版物並非旨在提供,也不構成TradingView提供或認可的任何形式的財務、投資、交易或其他類型的建議或推薦。請閱讀使用條款以了解更多資訊。