PROTECTED SOURCE SCRIPT
已更新 Volume Delta Histogram and Bands
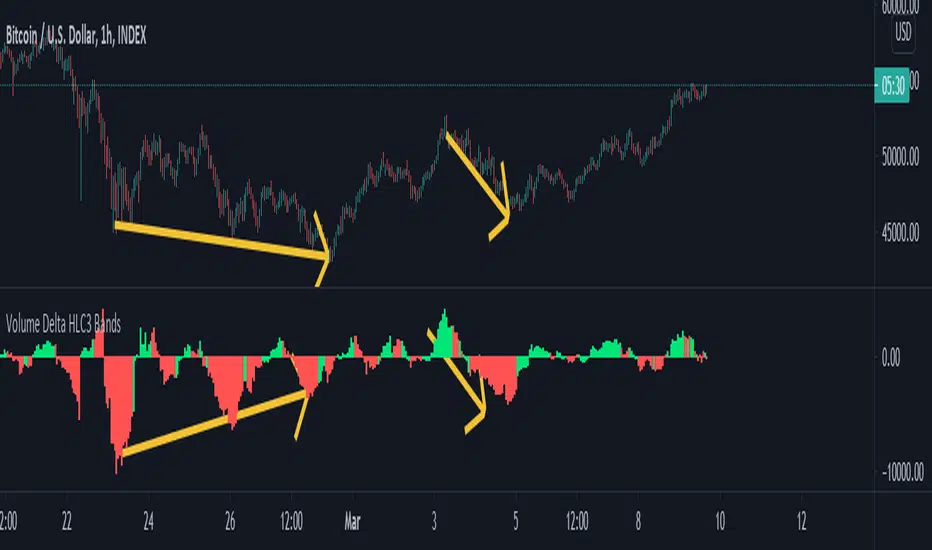
This study takes the lower timeframe volume from the specified "Volume Data Time Period", and calculates the sum of volume over the user specified "Volume Signal period", doing its best to take an approximation of delta.
This is displayed via a histogram, and can be used to trade divergences, see trends strengthen and weaken as illustrated on the chart below.

You can also display reversal areas, which will show when the "Volume Signal Period" exceeds one half of the average volume plus two standard deviations over the "Volume Comparison Period."
Think of this like bollinger bands for volume trends, when the bands are tight crossing outside them can signal strength, but when they are moderate or contracting it can show an area for a likely reversal.
This is displayed via a histogram, and can be used to trade divergences, see trends strengthen and weaken as illustrated on the chart below.
You can also display reversal areas, which will show when the "Volume Signal Period" exceeds one half of the average volume plus two standard deviations over the "Volume Comparison Period."
Think of this like bollinger bands for volume trends, when the bands are tight crossing outside them can signal strength, but when they are moderate or contracting it can show an area for a likely reversal.
發行說明
Fixed calculations and removed reversals, they didnt do much anyways.Histogram shows the volume over the comparison period, color of histogram is determined by delta volume over the signal period.
受保護腳本
此腳本以閉源形式發佈。 不過,您可以自由使用,沒有任何限制 — 點擊此處了解更多。
免責聲明
這些資訊和出版物並非旨在提供,也不構成TradingView提供或認可的任何形式的財務、投資、交易或其他類型的建議或推薦。請閱讀使用條款以了解更多資訊。
受保護腳本
此腳本以閉源形式發佈。 不過,您可以自由使用,沒有任何限制 — 點擊此處了解更多。
免責聲明
這些資訊和出版物並非旨在提供,也不構成TradingView提供或認可的任何形式的財務、投資、交易或其他類型的建議或推薦。請閱讀使用條款以了解更多資訊。