OPEN-SOURCE SCRIPT
Buy/Sell Volume Balance
DESCRIPTION
Buy/Sell Volume Balance is a simple yet powerful indicator designed to measure and visualize the balance between buying and selling volume over a customizable number of recent candles. It helps traders quickly assess market pressure during consolidation phases or ranges, in order to anticipate the most likely breakout direction.
How it works
The indicator analyzes the last N candles (default = 100, user-editable).
Each candle’s total volume is classified as:
Bullish volume (Buy volume): if the candle closes above or equal to its open.
Bearish volume (Sell volume): if the candle closes below its open.
The volumes are summed separately to calculate:
Total Buy Volume
Total Sell Volume
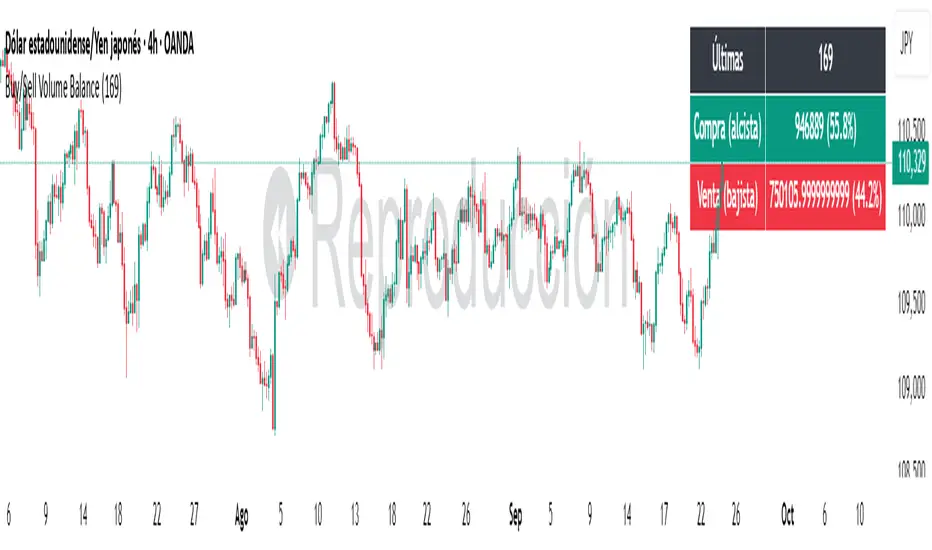
The percentage of each side relative to the total is also displayed.
All results are shown in a fixed table at the top of the chart for quick interpretation.
Purpose
This tool is specifically designed to help traders evaluate the internal battle between buyers and sellers during a range or sideways market. By understanding which side is accumulating more volume within the range, traders can anticipate which direction is more likely when the price breaks out.
If Buy volume dominates → potential bullish breakout.
If Sell volume dominates → potential bearish breakout.
If both sides are nearly balanced, it signals indecision and a higher chance of false breakouts.
Imbalance Threshold
In practice, traders often consider a clear imbalance when one side reaches at least 55–60% of the total volume.
Above this threshold, the dominant side is more likely to dictate the breakout direction.
Below this threshold, the market is usually in indecision and further confirmation is needed before acting.
How to use it
Add the indicator to your chart and choose the lookback period (number of candles).
Focus on ranges or consolidation zones where price is moving sideways.
Observe the balance of Buy vs Sell volume in the top-right box:
A clear imbalance (>55–60%) suggests the stronger side is more likely to push the breakout.
A balanced ratio (<55–60%) indicates indecision and possible false breakouts.
Use it in combination with support/resistance zones, breakout patterns, or volume spikes for best results.
✅ In summary: This indicator does not give direct buy/sell signals, but it provides valuable context about market pressure, helping you to align your trades with the most probable breakout direction.
Buy/Sell Volume Balance is a simple yet powerful indicator designed to measure and visualize the balance between buying and selling volume over a customizable number of recent candles. It helps traders quickly assess market pressure during consolidation phases or ranges, in order to anticipate the most likely breakout direction.
How it works
The indicator analyzes the last N candles (default = 100, user-editable).
Each candle’s total volume is classified as:
Bullish volume (Buy volume): if the candle closes above or equal to its open.
Bearish volume (Sell volume): if the candle closes below its open.
The volumes are summed separately to calculate:
Total Buy Volume
Total Sell Volume
The percentage of each side relative to the total is also displayed.
All results are shown in a fixed table at the top of the chart for quick interpretation.
Purpose
This tool is specifically designed to help traders evaluate the internal battle between buyers and sellers during a range or sideways market. By understanding which side is accumulating more volume within the range, traders can anticipate which direction is more likely when the price breaks out.
If Buy volume dominates → potential bullish breakout.
If Sell volume dominates → potential bearish breakout.
If both sides are nearly balanced, it signals indecision and a higher chance of false breakouts.
Imbalance Threshold
In practice, traders often consider a clear imbalance when one side reaches at least 55–60% of the total volume.
Above this threshold, the dominant side is more likely to dictate the breakout direction.
Below this threshold, the market is usually in indecision and further confirmation is needed before acting.
How to use it
Add the indicator to your chart and choose the lookback period (number of candles).
Focus on ranges or consolidation zones where price is moving sideways.
Observe the balance of Buy vs Sell volume in the top-right box:
A clear imbalance (>55–60%) suggests the stronger side is more likely to push the breakout.
A balanced ratio (<55–60%) indicates indecision and possible false breakouts.
Use it in combination with support/resistance zones, breakout patterns, or volume spikes for best results.
✅ In summary: This indicator does not give direct buy/sell signals, but it provides valuable context about market pressure, helping you to align your trades with the most probable breakout direction.
開源腳本
秉持TradingView一貫精神,這個腳本的創作者將其設為開源,以便交易者檢視並驗證其功能。向作者致敬!您可以免費使用此腳本,但請注意,重新發佈代碼需遵守我們的社群規範。
免責聲明
這些資訊和出版物並非旨在提供,也不構成TradingView提供或認可的任何形式的財務、投資、交易或其他類型的建議或推薦。請閱讀使用條款以了解更多資訊。
開源腳本
秉持TradingView一貫精神,這個腳本的創作者將其設為開源,以便交易者檢視並驗證其功能。向作者致敬!您可以免費使用此腳本,但請注意,重新發佈代碼需遵守我們的社群規範。
免責聲明
這些資訊和出版物並非旨在提供,也不構成TradingView提供或認可的任何形式的財務、投資、交易或其他類型的建議或推薦。請閱讀使用條款以了解更多資訊。