OPEN-SOURCE SCRIPT
Vorse4
**Vorse4 Indicator**
The Vorse4 Indicator is a technical analysis tool that combines Chaikin Oscillator, Intraday Momentum Index (IMI), MACD, and Parabolic SAR indicators. This indicator generates trading signals when all four indicators simultaneously provide buy or sell signals and visually presents these signals on the chart.
**How to Use:**
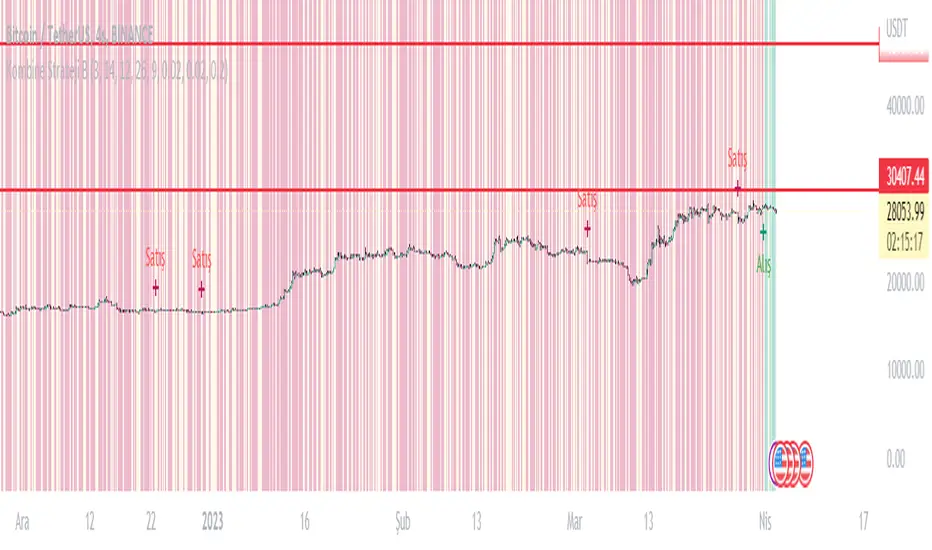
1. Buy signal: A buy signal is generated when there is a positive crossover in the Chaikin Oscillator, the IMI is above 50, the MACD line crosses the signal line upwards, and the price is above the Parabolic SAR. It is marked with a green arrow below the chart.
2. Sell signal: A sell signal is generated when there is a negative crossover in the Chaikin Oscillator, the IMI is below 50, the MACD line crosses the signal line downwards, and the price is below the Parabolic SAR. It is marked with a red arrow above the chart.
3. Turning zones: Areas with a high probability of transitioning from buy to sell or sell to buy are marked in yellow. These zones are determined by monitoring turning points in the Chaikin Oscillator, MACD, and Intraday Momentum Index.
**How to Apply:**
1. In your TradingView chart, go to the indicators menu and search for the "Vorse4" indicator.
2. Add the indicator to your chart. You will see green and red arrows indicating buy and sell signals, as well as yellow-colored areas representing turning zones on your chart.
3. Observe the buy and sell signals and trade according to your strategy. Analyze the performance of the indicator on historical data to evaluate the reliability of the signals.
**Note:** You can adjust the indicator parameters to balance the frequency and accuracy of buy and sell signals. Each strategy has a different risk-reward balance, so you can try different values to find the one that works best for you.
The Vorse4 Indicator is a technical analysis tool that combines Chaikin Oscillator, Intraday Momentum Index (IMI), MACD, and Parabolic SAR indicators. This indicator generates trading signals when all four indicators simultaneously provide buy or sell signals and visually presents these signals on the chart.
**How to Use:**
1. Buy signal: A buy signal is generated when there is a positive crossover in the Chaikin Oscillator, the IMI is above 50, the MACD line crosses the signal line upwards, and the price is above the Parabolic SAR. It is marked with a green arrow below the chart.
2. Sell signal: A sell signal is generated when there is a negative crossover in the Chaikin Oscillator, the IMI is below 50, the MACD line crosses the signal line downwards, and the price is below the Parabolic SAR. It is marked with a red arrow above the chart.
3. Turning zones: Areas with a high probability of transitioning from buy to sell or sell to buy are marked in yellow. These zones are determined by monitoring turning points in the Chaikin Oscillator, MACD, and Intraday Momentum Index.
**How to Apply:**
1. In your TradingView chart, go to the indicators menu and search for the "Vorse4" indicator.
2. Add the indicator to your chart. You will see green and red arrows indicating buy and sell signals, as well as yellow-colored areas representing turning zones on your chart.
3. Observe the buy and sell signals and trade according to your strategy. Analyze the performance of the indicator on historical data to evaluate the reliability of the signals.
**Note:** You can adjust the indicator parameters to balance the frequency and accuracy of buy and sell signals. Each strategy has a different risk-reward balance, so you can try different values to find the one that works best for you.
開源腳本
秉持TradingView一貫精神,這個腳本的創作者將其設為開源,以便交易者檢視並驗證其功能。向作者致敬!您可以免費使用此腳本,但請注意,重新發佈代碼需遵守我們的社群規範。
免責聲明
這些資訊和出版物並非旨在提供,也不構成TradingView提供或認可的任何形式的財務、投資、交易或其他類型的建議或推薦。請閱讀使用條款以了解更多資訊。
免責聲明
這些資訊和出版物並非旨在提供,也不構成TradingView提供或認可的任何形式的財務、投資、交易或其他類型的建議或推薦。請閱讀使用條款以了解更多資訊。