OPEN-SOURCE SCRIPT
已更新 Trend Structure Shift By BCB Elevate
Trend Structure Shift by BCB Elevate
This indicator helps traders identify trend structure shifts by detecting Higher Highs (HH) and Lower Lows (LL) to determine bullish, bearish, or neutral market conditions. It provides real-time trend classification to help traders align with market direction.
How It Works:
📌 Bullish Trend: A new Higher High (HH) is detected, signaling potential uptrend continuation.
📌 Bearish Trend: A new Lower Low (LL) is detected, indicating potential downtrend continuation.
📌 Neutral: No significant trend shift is detected.
Key Features:
✅ Dynamic Trend Detection – Identifies key trend structure shifts using swing highs and lows.
✅ Customizable Settings – Adjust the swing length to fine-tune trend detection.
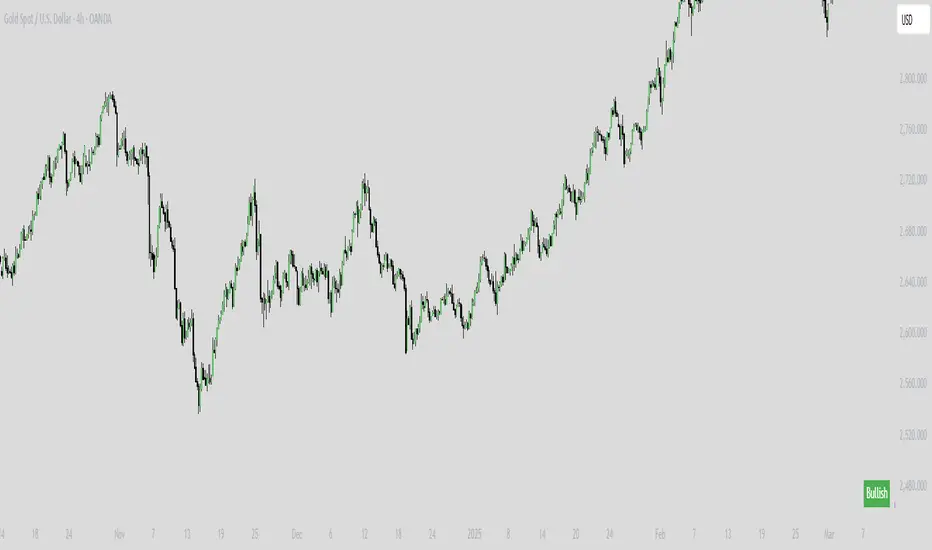
✅ Trend Table Display – Shows current trend as Bullish, Bearish, or Neutral in a convenient on-chart table.
✅ Table Position Selection – Choose where the trend table appears on the chart (Top/Bottom Left or Right).
✅ Works on All Markets & Timeframes – Use it for Crypto, Forex, Stocks, Commodities, and Indices.
How to Use:
1️⃣ Apply the indicator to your chart.
2️⃣ Observe the Trend Table to determine the market condition.
3️⃣ Use it with support/resistance, moving averages, or other indicators for better trade decisions.
This indicator helps traders identify trend structure shifts by detecting Higher Highs (HH) and Lower Lows (LL) to determine bullish, bearish, or neutral market conditions. It provides real-time trend classification to help traders align with market direction.
How It Works:
📌 Bullish Trend: A new Higher High (HH) is detected, signaling potential uptrend continuation.
📌 Bearish Trend: A new Lower Low (LL) is detected, indicating potential downtrend continuation.
📌 Neutral: No significant trend shift is detected.
Key Features:
✅ Dynamic Trend Detection – Identifies key trend structure shifts using swing highs and lows.
✅ Customizable Settings – Adjust the swing length to fine-tune trend detection.
✅ Trend Table Display – Shows current trend as Bullish, Bearish, or Neutral in a convenient on-chart table.
✅ Table Position Selection – Choose where the trend table appears on the chart (Top/Bottom Left or Right).
✅ Works on All Markets & Timeframes – Use it for Crypto, Forex, Stocks, Commodities, and Indices.
How to Use:
1️⃣ Apply the indicator to your chart.
2️⃣ Observe the Trend Table to determine the market condition.
3️⃣ Use it with support/resistance, moving averages, or other indicators for better trade decisions.
發行說明
minor fixes開源腳本
秉持TradingView一貫精神,這個腳本的創作者將其設為開源,以便交易者檢視並驗證其功能。向作者致敬!您可以免費使用此腳本,但請注意,重新發佈代碼需遵守我們的社群規範。
免責聲明
這些資訊和出版物並非旨在提供,也不構成TradingView提供或認可的任何形式的財務、投資、交易或其他類型的建議或推薦。請閱讀使用條款以了解更多資訊。
開源腳本
秉持TradingView一貫精神,這個腳本的創作者將其設為開源,以便交易者檢視並驗證其功能。向作者致敬!您可以免費使用此腳本,但請注意,重新發佈代碼需遵守我們的社群規範。
免責聲明
這些資訊和出版物並非旨在提供,也不構成TradingView提供或認可的任何形式的財務、投資、交易或其他類型的建議或推薦。請閱讀使用條款以了解更多資訊。