INVITE-ONLY SCRIPT
H/V/Q Volatility Index v2.0
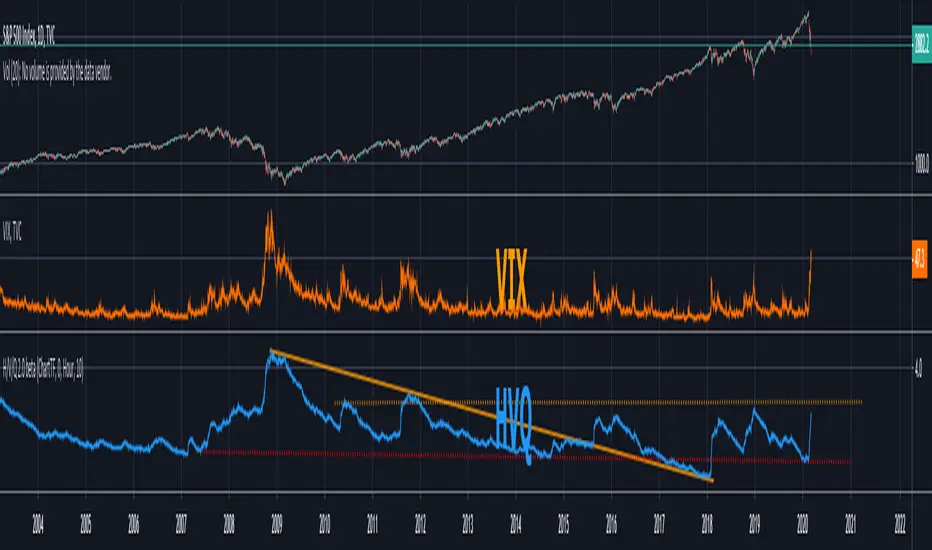
This is a standalone version of the volatility calculation used in QuantRsi. It is a relatively complex volatility-specific filtering calculation designed to give deeper insight into volatility trends for any asset class.
Use with Log scaling on the indicator's value scalar.
This tool offers an alternative model for volatility calculation. Experience using this tool proves that it extends the efficacy of volatility prediction techniques, and allows deeper technical analysis within volatility moves.
Use alongside conventional volatility indices to find opportunities within option chains to long or short volatility when HVQ provides evidence for volatility reversal that other options value models have not priced in.
Use as part of a predictive based risk management strategy.
Use alongside QuantRsi and HeffaeClouds as a complete trading suite, sans volume analysis, and gain insight not offered by any other indicator set.
SETTINGS:
TimeFrame settings:
Chart/Custom timeframe inputs are carried over from HeffaeClouds and QuantRsi indicators. Allows you to assign any non-chart timeframe to the indicator:
More Settings:
If there is a feature you would like, question answered, or a bug to report, visit the TradingView SNOW_CITY public chat-room; link in my signature
Use the pastebin link below for indicator access information and pricing
Use with Log scaling on the indicator's value scalar.
This tool offers an alternative model for volatility calculation. Experience using this tool proves that it extends the efficacy of volatility prediction techniques, and allows deeper technical analysis within volatility moves.
Use alongside conventional volatility indices to find opportunities within option chains to long or short volatility when HVQ provides evidence for volatility reversal that other options value models have not priced in.
Use as part of a predictive based risk management strategy.
Use alongside QuantRsi and HeffaeClouds as a complete trading suite, sans volume analysis, and gain insight not offered by any other indicator set.
SETTINGS:
TimeFrame settings:
Chart/Custom timeframe inputs are carried over from HeffaeClouds and QuantRsi indicators. Allows you to assign any non-chart timeframe to the indicator:
- "ChartTF" follows your chart's selected resolution / TimeFrame
- "Non-Chart TimeFrame" is an integer for your custom TimeFrame, the setting below:
- "Non-Chart TimeFrame" selects "Minutes, Hours, Days" that corresponds to the above setting for a custom TimeFrame.
More Settings:
- "Invert Output switch" will invert the volatility chart scale. Useful for visualizing some trends on assets that regularly correlate large volatility spikes with disorderly selloffs.
- "Show High/Low Volt range" switch (experimental) shows the high/low extremes of alternate volatility window calculations. There is insight to be gained from large differences v.s. all ranges trending near the same values.
- "Relative value switch" (experimental) divides the HVQ values by the hl2 candle price, per candle. This is a unique way to filter the output, visualize the volatility value per asset value.
- "Range Multiplier" adjusts the average window length HVQ uses for calculations. This has been finely tuned so that the value of "10" corresponds to the best average fitting of all assets and timeframes. In most situations TimeFrame should be used to alter the real window periods and this should be left at default. Instead you can change this to find better fitting if you'd like.
If there is a feature you would like, question answered, or a bug to report, visit the TradingView SNOW_CITY public chat-room; link in my signature
Use the pastebin link below for indicator access information and pricing
SNOW_CITY public chat room - Indicator Q&A
tradingview.com/chat/
Indicator access information
pastebin.com/v8sp6Y3R
tradingview.com/chat/
Indicator access information
pastebin.com/v8sp6Y3R
免責聲明
這些資訊和出版物並不意味著也不構成TradingView提供或認可的金融、投資、交易或其他類型的意見或建議。請在使用條款閱讀更多資訊。
SNOW_CITY public chat room - Indicator Q&A
tradingview.com/chat/
Indicator access information
pastebin.com/v8sp6Y3R
tradingview.com/chat/
Indicator access information
pastebin.com/v8sp6Y3R
免責聲明
這些資訊和出版物並不意味著也不構成TradingView提供或認可的金融、投資、交易或其他類型的意見或建議。請在使用條款閱讀更多資訊。