INVITE-ONLY SCRIPT
已更新 Zeta Scanner

It is a well known fact that actual drivers of the market are Big Institutions, Mutual Funds & Big Guys with deep pockets.
They have large amounts of money to invest and they buy & sell in bulk.
When they buy, often their objective is to buy at lower levels (below average price of the day) & when they sell they sell at higher levels (above average price of the day).
Zeta Scanner seeks to detect this activity. When aggressive buying or selling starts where Buying & Selling Forces become unequal, the Price starts moving in one direction with candles making Higher Highs or Lower Lows.
Zeta Scanner detects these Higher Highs or Lower Lows and generates Buy or Sell signals when this happens.
In order to use this scanner, simply deploy this on your chart, and wait for Buy/Sell signals.
Primarily, it is meant for Intraday trades and works best with 5 min, 10 min, 15 min & 30 min. time frames.
When a Buy Signal is followed by Sell signal (let it be after 3 - 4 candles or after many candles) or vice-versa, you have to switch your position to make most of the reverse move.
It is a general purpose indicator and may be used on stocks, commodities and currencies alike and is not meant for any specific market.
發行說明
Added provision so that 10 minute time-frame could also be used.發行說明
Tweaked the code to filter out low probability or high risk signals and detect some more good signals based upon momentum.發行說明
Removed Repeating Buy/Sell Signals.發行說明
Changed Indicator Name to Zeta Scanner+發行說明
Updated code to remove some false positives.發行說明
We have tweaked the code further to catch some better trades. Also, traders may use following methodology while using this indicaror:1. If you take a Buy Trade, hold your position till either (a) You Get a 'Sell' Signal or (b) Your Stop Loss Gets Hit. Ideally, Stop Loss should be the low of candle which just precedes the Buy Signal candle.
2. If you take a Sell Trade, hold your position till either (a) You Get a 'Buy' Signal or (b) Your Stop Loss Gets Hit. Ideally, Stop Loss should be the High of candle which just precedes the Sell Signal candle.
All suggestions which help us improve the code will be welcomed.
發行說明
Made the provision to bypass Buy/Sell Signals generated during Pre-Open and Post Close session values.發行說明
Overhauled the entire code to pick up Gap Up & Gap Down Traps.發行說明
The code is tweaked to detect panic selling or buying and short-title name has been changed.發行說明
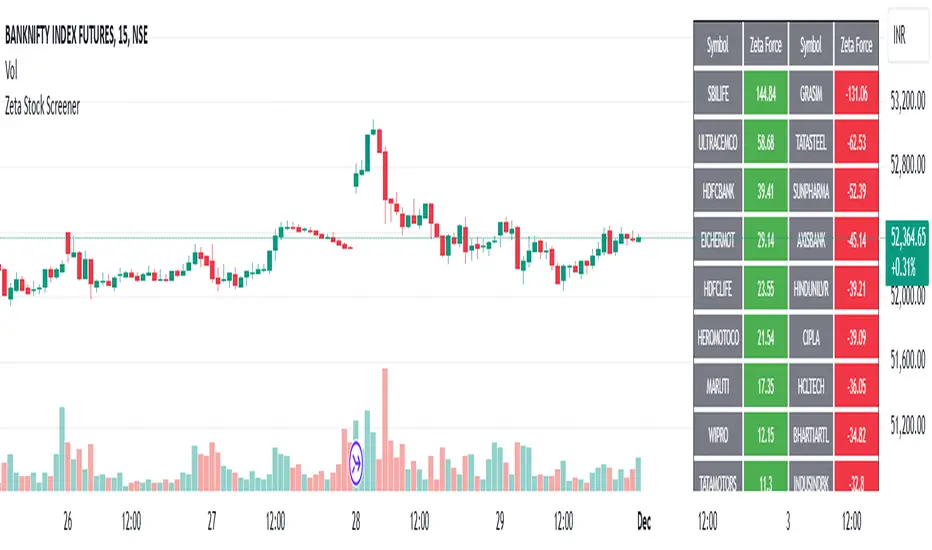
Introduced New Features to sort stocks disregarding sectors發行說明
Code updated to Pine Script V6僅限邀請腳本
僅作者批准的使用者才能訪問此腳本。您需要申請並獲得使用許可,通常需在付款後才能取得。更多詳情,請依照作者以下的指示操作,或直接聯絡jellygill。
TradingView不建議在未完全信任作者並了解其運作方式的情況下購買或使用腳本。您也可以在我們的社群腳本中找到免費的開源替代方案。
作者的說明
This can be used to select stocks for your intra-day as well as swing trading. The time frame for intra-day can be 5 min.. and for swing trades no less than 15 min.
To avail FREE TRIAL for all our invite-only indicators, please contact us:
Telegram: @jellygill
Our Telegram Channel: @CheetaTrader
join to complete FREE TRAINING on how to use the indicators effectively and then request @jellygill for FREE TRIAL
Telegram: @jellygill
Our Telegram Channel: @CheetaTrader
join to complete FREE TRAINING on how to use the indicators effectively and then request @jellygill for FREE TRIAL
免責聲明
這些資訊和出版物並非旨在提供,也不構成TradingView提供或認可的任何形式的財務、投資、交易或其他類型的建議或推薦。請閱讀使用條款以了解更多資訊。
僅限邀請腳本
僅作者批准的使用者才能訪問此腳本。您需要申請並獲得使用許可,通常需在付款後才能取得。更多詳情,請依照作者以下的指示操作,或直接聯絡jellygill。
TradingView不建議在未完全信任作者並了解其運作方式的情況下購買或使用腳本。您也可以在我們的社群腳本中找到免費的開源替代方案。
作者的說明
This can be used to select stocks for your intra-day as well as swing trading. The time frame for intra-day can be 5 min.. and for swing trades no less than 15 min.
To avail FREE TRIAL for all our invite-only indicators, please contact us:
Telegram: @jellygill
Our Telegram Channel: @CheetaTrader
join to complete FREE TRAINING on how to use the indicators effectively and then request @jellygill for FREE TRIAL
Telegram: @jellygill
Our Telegram Channel: @CheetaTrader
join to complete FREE TRAINING on how to use the indicators effectively and then request @jellygill for FREE TRIAL
免責聲明
這些資訊和出版物並非旨在提供,也不構成TradingView提供或認可的任何形式的財務、投資、交易或其他類型的建議或推薦。請閱讀使用條款以了解更多資訊。