OPEN-SOURCE SCRIPT
Clustered Asset Moving Average @shrilss
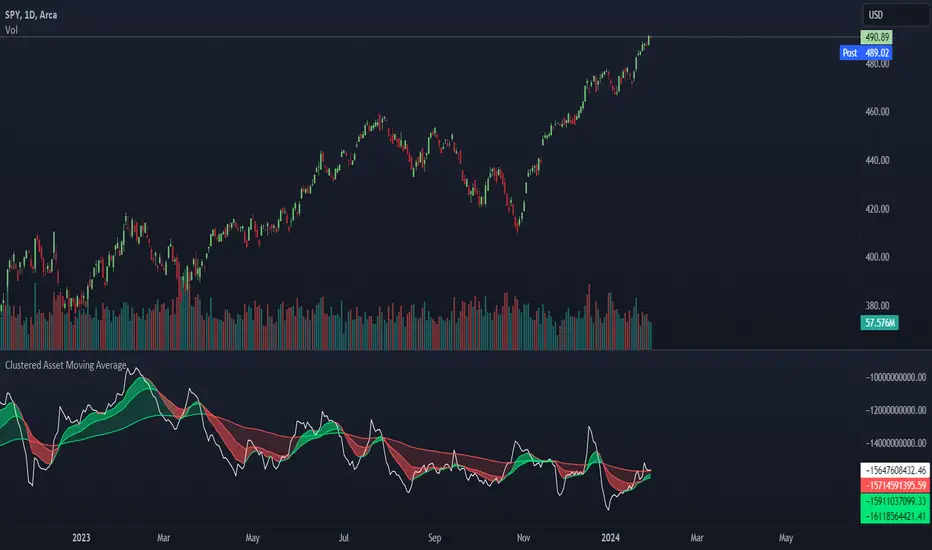
The Clustered Asset Moving Average script is designed to provide traders with a unique perspective on a cluster of multiple assets. By combining the closing prices and volumes of 12 specified assets, this indicator calculates a Clustered Moving Average to reveal potential trends and market sentiment within this asset cluster.
Key Features:
- Asset Cluster Analysis:
The script considers 12 assets, including well-known names such as Google (GOOG), Microsoft (MSFT), Apple (AAPL), Tesla (TSLA), and others.
It calculates the price and volume of each asset to form a comprehensive view of the asset cluster.
- Clustered Moving Average Calculation:
The Asset Price and Volume are combined to calculate the Clustered Moving Average
This moving average reflects the relationship between the aggregated price and volume of the specified assets.
- Multiple Exponential Moving Averages (EMA):
The script includes three EMAs (10, 25, and 100) applied to the Clustered Moving Average, providing different time perspectives.
Users can customize the visibility of each EMA based on their trading preferences.
- Visual Representation:
The indicator offers a visual representation of the Clustered Moving Average, allowing traders to quickly identify trends and potential reversal points.
Different EMAs are color-coded, enhancing visual clarity.
開源腳本
秉持TradingView一貫精神,這個腳本的創作者將其設為開源,以便交易者檢視並驗證其功能。向作者致敬!您可以免費使用此腳本,但請注意,重新發佈代碼需遵守我們的社群規範。
免責聲明
這些資訊和出版物並非旨在提供,也不構成TradingView提供或認可的任何形式的財務、投資、交易或其他類型的建議或推薦。請閱讀使用條款以了解更多資訊。
免責聲明
這些資訊和出版物並非旨在提供,也不構成TradingView提供或認可的任何形式的財務、投資、交易或其他類型的建議或推薦。請閱讀使用條款以了解更多資訊。