OPEN-SOURCE SCRIPT
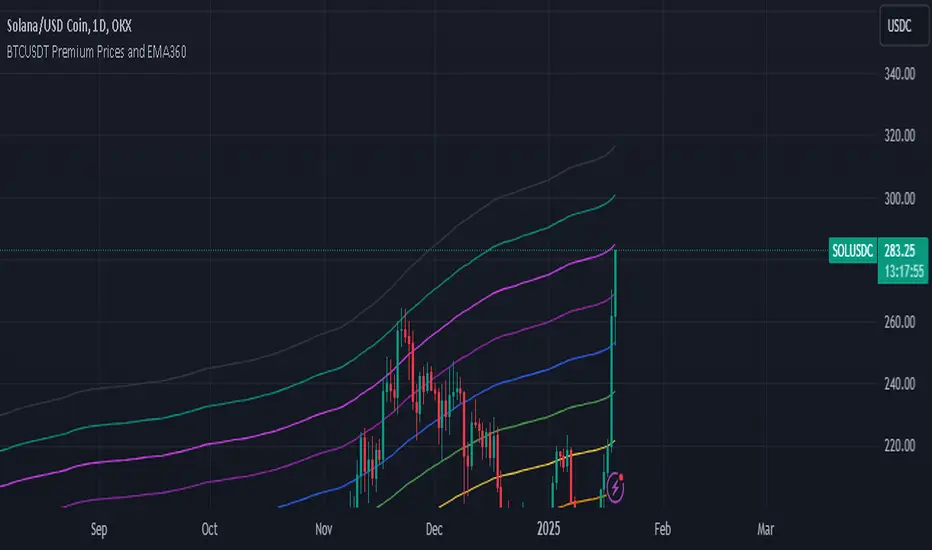
BTCUSDT Premium Prices and EMA360
The Exponential Moving Average (EMA) is a widely used technical indicator in trading that helps analysts and traders identify price trends over a specified period. Unlike the Simple Moving Average (SMA), which treats all data points equally, the EMA gives more weight to recent prices, making it more sensitive to recent price movements. This characteristic allows the EMA to react quickly to changes in market conditions, providing timely insights into potential trends.
## **Key Features of EMA**
- **Weighting Mechanism**: The EMA uses a smoothing factor that emphasizes recent price data while still considering older observations. This leads to a more dynamic representation of price trends compared to the SMA[1][4].
- **Trend Identification**: The EMA is particularly effective for identifying the direction of a stock's price movement. A rising EMA indicates an uptrend, while a declining EMA suggests a downtrend. Traders often use multiple EMAs with different periods to spot crossovers, which can signal potential buy or sell opportunities[2][5].
- **Calculation**: To calculate the EMA, one typically starts with an initial Simple Moving Average (SMA) for the first period, then applies the following formula for subsequent periods:
$$
\text{EMA}_{\text{today}} = \left(\text{Price}_{\text{today}} \times \left(\frac{2}{N + 1}\right)\right) + \left(\text{EMA}_{\text{yesterday}} \times \left(1 - \frac{2}{N + 1}\right)\right)
$$
Where $$N$$ is the number of periods[3][6].
## **Applications in Trading**
Traders utilize the EMA in various strategies, including:
- **Crossover Strategies**: By monitoring two EMAs of different lengths (e.g., 50-day and 200-day), traders can identify bullish or bearish signals when one crosses above or below the other[2][5].
- **Combining Indicators**: The EMA can be combined with other indicators like the Relative Strength Index (RSI) or Moving Average Convergence Divergence (MACD) for enhanced decision-making[2][4].
In summary, the Exponential Moving Average is a crucial tool for traders seeking to navigate market trends effectively. Its ability to prioritize recent data makes it an essential component of many trading strategies, providing insights that can lead to informed investment decisions.
開源腳本
秉持TradingView一貫精神,這個腳本的創作者將其設為開源,以便交易者檢視並驗證其功能。向作者致敬!您可以免費使用此腳本,但請注意,重新發佈代碼需遵守我們的社群規範。
免責聲明
這些資訊和出版物並非旨在提供,也不構成TradingView提供或認可的任何形式的財務、投資、交易或其他類型的建議或推薦。請閱讀使用條款以了解更多資訊。
開源腳本
秉持TradingView一貫精神,這個腳本的創作者將其設為開源,以便交易者檢視並驗證其功能。向作者致敬!您可以免費使用此腳本,但請注意,重新發佈代碼需遵守我們的社群規範。
免責聲明
這些資訊和出版物並非旨在提供,也不構成TradingView提供或認可的任何形式的財務、投資、交易或其他類型的建議或推薦。請閱讀使用條款以了解更多資訊。