OPEN-SOURCE SCRIPT
已更新 Naked - Daily Weekly Monthly
User request for Naked Daily Weekly Monthly Opens.
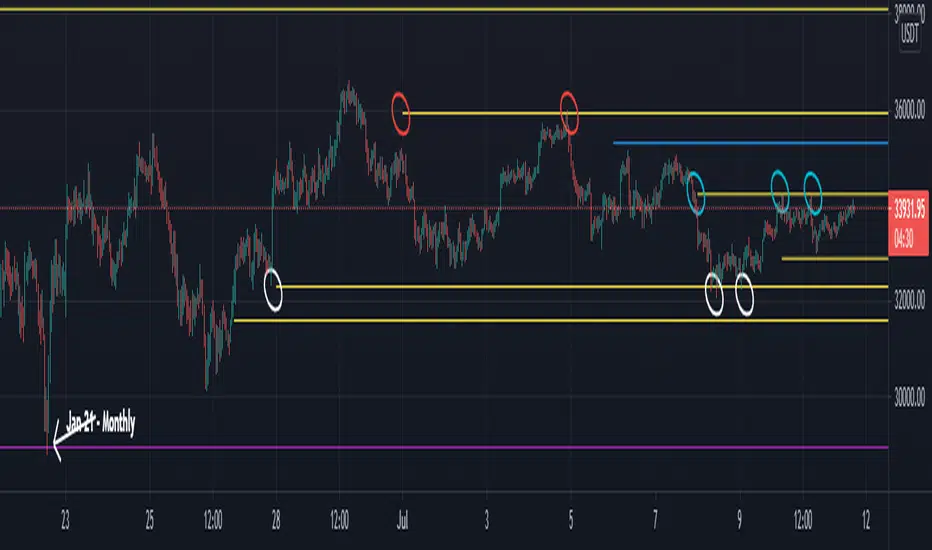
This indicator plots the Daily Weekly Opens (the day after day after creation), they then will stay on the chart until a candle close is completed on the other side of the plot.
In the above chart picture you can see how previous monthly and daily opens have acted as support and resistance.
Thanks go to:
StackOverFlow Bjorn Mistiaen
發行說明
Disclaimer This indicator works on the daily timeframe and below.
To pick up all naked lines move the chart back in time and then back to current price action.
發行說明
Update:User request for different line style options.
User can now change the line style from solid to dashed or dotted.
發行說明
Error highlighted by user in comments. Code updated to resolve issue.
發行說明
Script update:The script will now show totally Naked and Partially Naked Daily / Weekly / Monthly opens.
When looking back a previous price action keeping the partially Naked Opens as an option looks like a promising level for Technical Analysis.
Totally Naked = No price action breaks the level.
Partially Naked = Either the close or the open candles (Timeframe dependent) has not occurred below or above the level (dependent on Price Action to the level above or below).
開源腳本
本著TradingView的真正精神,此腳本的創建者將其開源,以便交易者可以查看和驗證其功能。向作者致敬!雖然您可以免費使用它,但請記住,重新發佈程式碼必須遵守我們的網站規則。
免責聲明
這些資訊和出版物並不意味著也不構成TradingView提供或認可的金融、投資、交易或其他類型的意見或建議。請在使用條款閱讀更多資訊。
開源腳本
本著TradingView的真正精神,此腳本的創建者將其開源,以便交易者可以查看和驗證其功能。向作者致敬!雖然您可以免費使用它,但請記住,重新發佈程式碼必須遵守我們的網站規則。
免責聲明
這些資訊和出版物並不意味著也不構成TradingView提供或認可的金融、投資、交易或其他類型的意見或建議。請在使用條款閱讀更多資訊。