INVITE-ONLY SCRIPT
已更新 Spiral Guide Algorithm [V2]
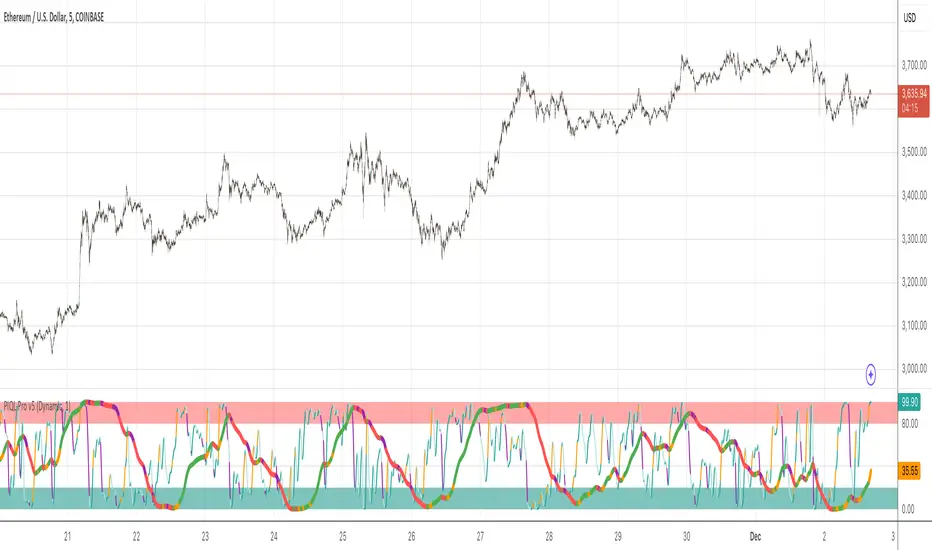
Spiral Guide Algorithm (SGA)
At its core, the Spiral Guide Algorithm is a low noise, un-bounded, oscillating cycle indicator designed to capture state change within a non-Gaussian distribution.
The idea, design, and application of the Spiral Guide Algorithm is rooted in first principles from four core areas of study, and in application proves to be an excellent trend following tool.
The Spiral Guide Algorithm produces and visualizes three principal components. Below we will cover each of those areas, as well as, how to apply this algorithm in trade analysis.
Principal Components
1. SGA Signal = waveform fundamental signal line
2. SGA Filtered Signal= finite impulse response filter of the SGA signal
3. SGA Histogram= delta between SGA signal and SGA filtered signal
Theory of Operation
1. Digital Signal Processing (DSP)
a. The SGA applies a DSP technique used in wireless transmission that decomposes a waveform into discrete components and then quantifies the interaction between each of those components.
2. Complex Systems Theory
a. In complex systems the tail often wags the dog and so SGA focuses not on the average of the distribution, but on the edges.
3. Game Theory
a. Positive feedback drives large changes from historical extremes, so targeting points of extreme oscillation offers the best chance of capturing large changes in the distribution.
4. Auction Theory
a. We know the auction process cycles between two phases:
i. At value
ii. Discovering value
b. SGA is designed to capture much of the “value discovery” phase between two “at value” areas.
Derivatives
1. When the SGA signal line is above 0 the time frame is up-trending
2. When the SGA signal line is below 0 the time frame is down-trending
3. A fundamental time frame shift is occurring when SGA signal line crosses 0
4. The ratio of SGA signal line time above 0 vs time below 0 will expose the current time frame bias (long, short, flat)
Application
1. Trades are signaled when the SGA signal line crosses the SGA filtered signal, and the trade is confirmed when the SGA filtered signal changes state.
2. Trades can be entered when the SGA signal line crosses 0.
3. SGA should align with the following before entering a trade: Structure, Cycles, Fractals.
4. The histogram is used for detecting divergence.
When and Where
1. Due to the large number of sample sets needed to calculate the SGA signal line, the SGA is designed for intraday charting.
2. Monitor multiple time frames around entry and exit time frame to satisfy the fractal requirements. As a rule, a 3-5x fractal above and below the entry and exit time frame is needed to align cycles.
3. For example:
a. Tick data or 1 second
b. 1 min
c. 5 min (entry/exit)
d. 15 min
4. This algorithm sees success in markets that are not mean reversion biased.
a. Trending markets with high volatility provide the best results.
發行說明
#Added Alerts for Each Tradable Condition of the SGA發行說明
Added functionality to allow reference timeframe to be modified; allowing for multi-timeframe analysis on a single chart via stacked SGA indicators發行說明
Added multi-timeframe functionality 發行說明
#Refactored most of the code#Added more functionality to adjust SGA indicator:
- Enable/disable SGA signal lines
- Enable/disable SGA histogram
- Divergence detection both positive and negative
- Redesigned histogram calculation to reduce false signals and increase tradeability
- SGA/Hist Max/Min enable/disable
- Long/Short Coloring
- SGA Fast
- SGA Very Fast
發行說明
Added SGA filter control Corrected alert print output
發行說明
Fixed scaling issue with OTFs發行說明
- Improved Settings MenuAdded OTF Heat MapAdded New Alert FunctionsRe-factored Core RoutinesAdded Signal Stat BoxAdded Histogram Stat Box
發行說明
Build 3.1 Hot Fix 1- Corrected Alert Logic
- Updated Alert Menu
發行說明
- updated script to include only user requested features
- improved loading times
- LTS SGA Version
發行說明
- Refactored most of of the code base
- Updated to Pinescript V5
- Updated Menu Section
- Added Liner Regression Channels
- Added SGA Prime Indicator
- Updated Alert Functionality
發行說明
- Fixed SGA Prime issue caused by TV backend
發行說明
- Added Strategy Visualizations
發行說明
- Added SGA Trend Confirm Tool
- Removed Stat Boxes
發行說明
- Updated SGA Trend Confirm
發行說明
- Added SGA Prime plot label
發行說明
- Added SGA Prime Strategy Settings & Alerts
發行說明
- Added Trend Confirm Plots
[*} Updated Trend Confirm Function
發行說明
- Corrected Data Input Formula
發行說明
- Corrected bug in TC
發行說明
- Added SGA TC Color Change Plots
發行說明
- Corrected Trend Confirm Plots
- Added Rev Control
發行說明
- Added Trend Confirm Alerts
- Removed SGA Crossing Zero Exit Filter
- Added Bot ID Selection In Settings
- Corrected Alerts "side":"exit" problem
發行說明
- Updated TC Plot to Show When No Bias Present
發行說明
Updated: - Re-organized menu structure
- Added SGA Prime forced alert
發行說明
Update:- Unknown TV bug; reverting to build 1.2
發行說明
- Removed unused plots due to hitting limit
- Re-organized menu structure
- Added SGA Prime forced alert
發行說明
- Updated SGA Color Alerts
發行說明
- refactored functions- removed extra code
發行說明
- corrected indicator name僅限邀請腳本
僅作者批准的使用者才能訪問此腳本。您需要申請並獲得使用許可,通常需在付款後才能取得。更多詳情,請依照作者以下的指示操作,或直接聯絡leerider。
TradingView不建議在未完全信任作者並了解其運作方式的情況下購買或使用腳本。您也可以在我們的社群腳本中找到免費的開源替代方案。
作者的說明
Unlock your success path with Prime IQ Labs!
Free Spiral Guide Algorithm (PIQL Pro v5) trial:
primeiqlabs.com/step/piql-pro-free-trial/
Join our FREE Discord server:
discord.gg/invite/primeiqlabs
Unlock your success path with Prime IQ Labs!
Get a FREE Spiral Guide Algorithm (PIQL Pro v5) trial:
primeiqlabs.com/step/piql-pro-free-trial/
Join our free Discord server:
discord.gg/invite/primeiqlabs
Get a FREE Spiral Guide Algorithm (PIQL Pro v5) trial:
primeiqlabs.com/step/piql-pro-free-trial/
Join our free Discord server:
discord.gg/invite/primeiqlabs
免責聲明
這些資訊和出版物並非旨在提供,也不構成TradingView提供或認可的任何形式的財務、投資、交易或其他類型的建議或推薦。請閱讀使用條款以了解更多資訊。
僅限邀請腳本
僅作者批准的使用者才能訪問此腳本。您需要申請並獲得使用許可,通常需在付款後才能取得。更多詳情,請依照作者以下的指示操作,或直接聯絡leerider。
TradingView不建議在未完全信任作者並了解其運作方式的情況下購買或使用腳本。您也可以在我們的社群腳本中找到免費的開源替代方案。
作者的說明
Unlock your success path with Prime IQ Labs!
Free Spiral Guide Algorithm (PIQL Pro v5) trial:
primeiqlabs.com/step/piql-pro-free-trial/
Join our FREE Discord server:
discord.gg/invite/primeiqlabs
Unlock your success path with Prime IQ Labs!
Get a FREE Spiral Guide Algorithm (PIQL Pro v5) trial:
primeiqlabs.com/step/piql-pro-free-trial/
Join our free Discord server:
discord.gg/invite/primeiqlabs
Get a FREE Spiral Guide Algorithm (PIQL Pro v5) trial:
primeiqlabs.com/step/piql-pro-free-trial/
Join our free Discord server:
discord.gg/invite/primeiqlabs
免責聲明
這些資訊和出版物並非旨在提供,也不構成TradingView提供或認可的任何形式的財務、投資、交易或其他類型的建議或推薦。請閱讀使用條款以了解更多資訊。