PROTECTED SOURCE SCRIPT
Relative Strength Momentum
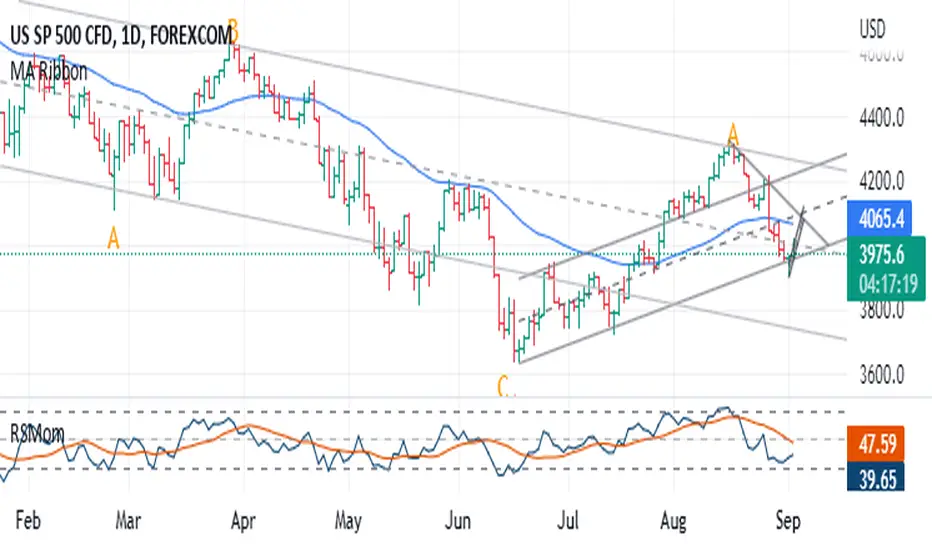
The RSI is a traders friend - it can provide insight that other indicators simply cannot. The RSI achilles heel is that it can often fail to highlight divergence. Constance Brown attempted to resolve this problem with the 'Composite index' - a powerful tool. However.. for me, looking at two indicators can get a bit much - especially if viewing multiple time-frames. I want one tool which provides the RSI, it's ranging/reversal behaviour (as documented by Andrew Cardwell) and a better grasp of momentum swings (via divergence and reversal signals). So this is my best effort, and I hope it can prove useful to some of you. At first the differences may be hard to spot - but they are there!
- My default settings are optimised - as with the 'normal' RSI you can expect a bullish trend to result in few (if any) moves below 30. In a bearish trend, you can expect few (if any) incursions above 70. Cardwell's observations apply. I recommend using this with a 50 period EMA to provide some additional context.
受保護腳本
此腳本以閉源形式發佈。 不過,您可以自由使用,沒有任何限制 — 點擊此處了解更多。
免責聲明
這些資訊和出版物並非旨在提供,也不構成TradingView提供或認可的任何形式的財務、投資、交易或其他類型的建議或推薦。請閱讀使用條款以了解更多資訊。
受保護腳本
此腳本以閉源形式發佈。 不過,您可以自由使用,沒有任何限制 — 點擊此處了解更多。
免責聲明
這些資訊和出版物並非旨在提供,也不構成TradingView提供或認可的任何形式的財務、投資、交易或其他類型的建議或推薦。請閱讀使用條款以了解更多資訊。