OPEN-SOURCE SCRIPT
MACD Trend Status
Overview:
The Dynamic MACD Trend Status indicator is a sophisticated yet easy-to-interpret tool designed to provide instant, color-coded insights into the current MACD momentum and trend strength directly on your chart. Unlike traditional MACD indicators that clutter your main price panel, this indicator distills complex MACD calculations into a single, prominent text label, ideal for quick confirmations and fast-paced trading.
It features two distinct logic modes, allowing you to customize its sensitivity and confirmation level, making it adaptable to various market conditions and trading styles.
Key Features & How It Works:
Two Selectable Logic Modes:
This indicator offers a unique dropdown setting (Logic Selection) to switch between two powerful MACD interpretation algorithms:
a) Option 3 (Robust) - (Default)
This is the most stringent and reliable mode, designed to filter out market noise and highlight only strong, accelerating trends. It declares a "Bullish" or "Bearish" status when ALL of the following conditions are met:
Bullish: MACD Line is above Signal Line AND MACD Histogram is positive AND MACD Histogram is increasing (momentum is accelerating) AND both MACD Line and Signal Line are above the Zero Line (confirming an overall uptrend).
Bearish: MACD Line is below Signal Line AND MACD Histogram is negative AND MACD Histogram is decreasing (momentum is accelerating) AND both MACD Line and Signal Line are below the Zero Line (confirming an overall downtrend).
Neutral: If none of the above strong conditions are met, indicating sideways movement, weakening momentum, or a transition phase.
b) Option 4 (Simplified + Enhanced)
This mode offers a more responsive signal while still providing a clear distinction for exceptionally strong moves. It determines status based on:
"MACD Bullish +" (Super Bullish): If all the rigorous conditions of "Option 3 (Robust) - Bullish" are met. This provides an immediate visual cue of extreme bullish strength within the simpler logic.
"MACD Bearish +" (Super Bearish): If all the rigorous conditions of "Option 3 (Robust) - Bearish" are met. This highlights exceptional bearish strength.
"MACD Bullish": MACD Line is above Signal Line AND MACD Histogram is positive (basic bullish momentum).
"MACD Bearish": MACD Line is below Signal Line AND MACD Histogram is negative (basic bearish momentum).
"MACD Neutral": If none of the above conditions are met.
Instant Color-Coded Status:
The indicator provides clear visual feedback through dynamic text colors:
Green: "MACD Bullish" (Standard Bullish)
Red: "MACD Bearish" (Standard Bearish)
Gray: "MACD Neutral" (Choppy/Unclear)
Blue: "MACD Bullish +" (Enhanced Strong Bullish - when using Option 4)
Fuchsia/Purple: "MACD Bearish +" (Enhanced Strong Bearish - when using Option 4)
(Note: Colors for "+" signals are customizable in the code if you wish)
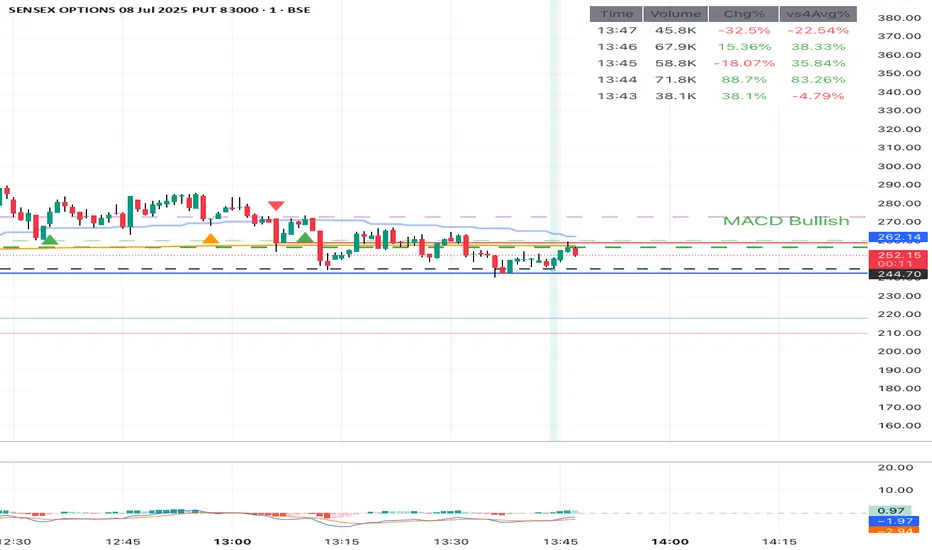
Unobtrusive Display:
The status is displayed in a transparent, discreet table positioned at the middle-right of your main chart panel. This avoids cluttering the top corners or the indicator sub-panel, keeping your price action clear.
Ideal Use Cases:
Quick Confirmation: Rapidly confirm your trade ideas with a glance at the MACD's underlying momentum.
Scalping & Day Trading: The instant visual feedback is invaluable for fast-paced short-term strategies.
Momentum Filtering: Use it to filter trades, ensuring you're entering when MACD momentum is in your favor.
Complementary Tool: Designed to work hand-in-hand with your primary analysis (price action, support/resistance, other indicators). It's not intended as a standalone signal but as a powerful re-confirmation tool.
Customization Options:
MACD Settings: Adjust Fast Length, Slow Length, and Signal Length.
Logic Selection: Toggle between "Option 3 (Robust)" and "Option 4 (Simplified)" for different sensitivities.
Show Status Text: Toggle the visibility of the status text On/Off.
Text Size: Choose from "tiny", "small", "normal", "large", "huge" for optimal visibility.
Important Disclaimer:
This indicator is a technical analysis tool and should be used as part of a comprehensive trading strategy. It is not financial advice. Trading in financial markets involves substantial risk, and you could lose money. Always perform your own research and risk management.
The Dynamic MACD Trend Status indicator is a sophisticated yet easy-to-interpret tool designed to provide instant, color-coded insights into the current MACD momentum and trend strength directly on your chart. Unlike traditional MACD indicators that clutter your main price panel, this indicator distills complex MACD calculations into a single, prominent text label, ideal for quick confirmations and fast-paced trading.
It features two distinct logic modes, allowing you to customize its sensitivity and confirmation level, making it adaptable to various market conditions and trading styles.
Key Features & How It Works:
Two Selectable Logic Modes:
This indicator offers a unique dropdown setting (Logic Selection) to switch between two powerful MACD interpretation algorithms:
a) Option 3 (Robust) - (Default)
This is the most stringent and reliable mode, designed to filter out market noise and highlight only strong, accelerating trends. It declares a "Bullish" or "Bearish" status when ALL of the following conditions are met:
Bullish: MACD Line is above Signal Line AND MACD Histogram is positive AND MACD Histogram is increasing (momentum is accelerating) AND both MACD Line and Signal Line are above the Zero Line (confirming an overall uptrend).
Bearish: MACD Line is below Signal Line AND MACD Histogram is negative AND MACD Histogram is decreasing (momentum is accelerating) AND both MACD Line and Signal Line are below the Zero Line (confirming an overall downtrend).
Neutral: If none of the above strong conditions are met, indicating sideways movement, weakening momentum, or a transition phase.
b) Option 4 (Simplified + Enhanced)
This mode offers a more responsive signal while still providing a clear distinction for exceptionally strong moves. It determines status based on:
"MACD Bullish +" (Super Bullish): If all the rigorous conditions of "Option 3 (Robust) - Bullish" are met. This provides an immediate visual cue of extreme bullish strength within the simpler logic.
"MACD Bearish +" (Super Bearish): If all the rigorous conditions of "Option 3 (Robust) - Bearish" are met. This highlights exceptional bearish strength.
"MACD Bullish": MACD Line is above Signal Line AND MACD Histogram is positive (basic bullish momentum).
"MACD Bearish": MACD Line is below Signal Line AND MACD Histogram is negative (basic bearish momentum).
"MACD Neutral": If none of the above conditions are met.
Instant Color-Coded Status:
The indicator provides clear visual feedback through dynamic text colors:
Green: "MACD Bullish" (Standard Bullish)
Red: "MACD Bearish" (Standard Bearish)
Gray: "MACD Neutral" (Choppy/Unclear)
Blue: "MACD Bullish +" (Enhanced Strong Bullish - when using Option 4)
Fuchsia/Purple: "MACD Bearish +" (Enhanced Strong Bearish - when using Option 4)
(Note: Colors for "+" signals are customizable in the code if you wish)
Unobtrusive Display:
The status is displayed in a transparent, discreet table positioned at the middle-right of your main chart panel. This avoids cluttering the top corners or the indicator sub-panel, keeping your price action clear.
Ideal Use Cases:
Quick Confirmation: Rapidly confirm your trade ideas with a glance at the MACD's underlying momentum.
Scalping & Day Trading: The instant visual feedback is invaluable for fast-paced short-term strategies.
Momentum Filtering: Use it to filter trades, ensuring you're entering when MACD momentum is in your favor.
Complementary Tool: Designed to work hand-in-hand with your primary analysis (price action, support/resistance, other indicators). It's not intended as a standalone signal but as a powerful re-confirmation tool.
Customization Options:
MACD Settings: Adjust Fast Length, Slow Length, and Signal Length.
Logic Selection: Toggle between "Option 3 (Robust)" and "Option 4 (Simplified)" for different sensitivities.
Show Status Text: Toggle the visibility of the status text On/Off.
Text Size: Choose from "tiny", "small", "normal", "large", "huge" for optimal visibility.
Important Disclaimer:
This indicator is a technical analysis tool and should be used as part of a comprehensive trading strategy. It is not financial advice. Trading in financial markets involves substantial risk, and you could lose money. Always perform your own research and risk management.
開源腳本
秉持TradingView一貫精神,這個腳本的創作者將其設為開源,以便交易者檢視並驗證其功能。向作者致敬!您可以免費使用此腳本,但請注意,重新發佈代碼需遵守我們的社群規範。
免責聲明
這些資訊和出版物並非旨在提供,也不構成TradingView提供或認可的任何形式的財務、投資、交易或其他類型的建議或推薦。請閱讀使用條款以了解更多資訊。
開源腳本
秉持TradingView一貫精神,這個腳本的創作者將其設為開源,以便交易者檢視並驗證其功能。向作者致敬!您可以免費使用此腳本,但請注意,重新發佈代碼需遵守我們的社群規範。
免責聲明
這些資訊和出版物並非旨在提供,也不構成TradingView提供或認可的任何形式的財務、投資、交易或其他類型的建議或推薦。請閱讀使用條款以了解更多資訊。