PROTECTED SOURCE SCRIPT
KIMATIX Market Structure
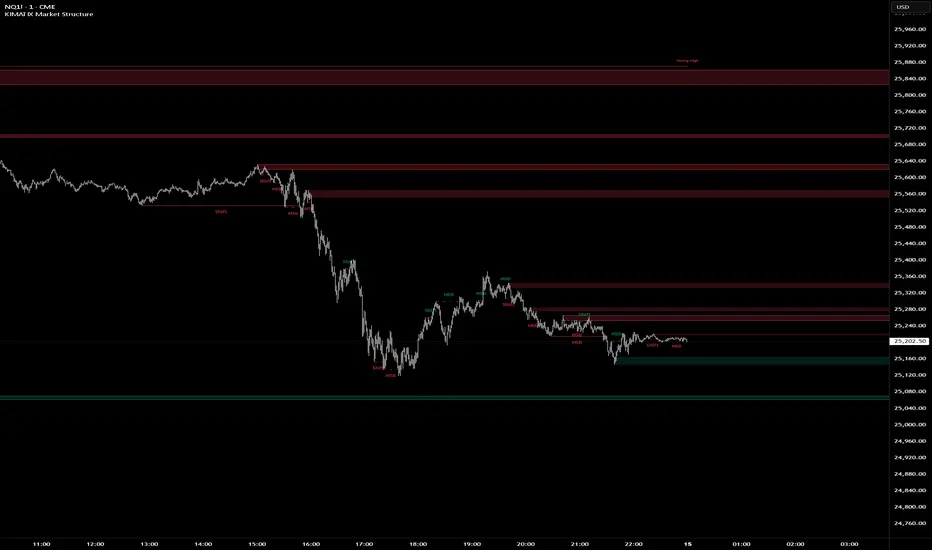
KIMATIX Market Structure is a professional-grade market structure and liquidity framework built for traders who focus on institutional price behavior, not lagging indicators.
This tool continuously analyzes price to map internal (micro) and external (macro) structure, giving you a clear read on whether the market is in continuation, transition, or reversal. Instead of guessing trend direction, you see it unfold in real time through structure breaks and shifts.
What the indicator helps you identify
Micro & Macro Market Structure
Internal structure for execution and timing
Higher-structure context for directional bias
Market Structure Breaks (MSB) vs. Shifts
MSB highlights continuation strength
Shift signals potential trend transition
Institutional Zones
Automatically derived zones where displacement occurred
Designed to highlight areas of likely reaction, mitigation, or continuation
Strong vs. Weak Highs and Lows
Instantly see which extremes are protected and which are vulnerable to liquidity raids
Optional Swing Logic (HH / HL / LH / LL)
For traders who want classic structure confirmation layered on top
Historical vs. Present Mode
Study full structure development or keep the chart clean and execution-focused
The indicator is intentionally not a signal generator. It is a decision-support tool designed to give clarity, context, and confluence. Best results come from combining it with session timing, liquidity concepts, and your execution model.
Built with strict object management and internal safeguards, the script remains fast and stable even on lower timeframes and extended chart history.
If you trade price action, liquidity, and structure, this tool is designed to fit seamlessly into your workflow.
More Indicators here: kimatixtrading.com
受保護腳本
此腳本以閉源形式發佈。 不過,您可以自由使用,沒有任何限制 — 點擊此處了解更多。
KIMATIX Trading
免責聲明
這些資訊和出版物並非旨在提供,也不構成TradingView提供或認可的任何形式的財務、投資、交易或其他類型的建議或推薦。請閱讀使用條款以了解更多資訊。
受保護腳本
此腳本以閉源形式發佈。 不過,您可以自由使用,沒有任何限制 — 點擊此處了解更多。
KIMATIX Trading
免責聲明
這些資訊和出版物並非旨在提供,也不構成TradingView提供或認可的任何形式的財務、投資、交易或其他類型的建議或推薦。請閱讀使用條款以了解更多資訊。