INVITE-ONLY SCRIPT
Range Indicator - Bitcoin Beats
Hello, Hello, Hello,
And welcome back to Bitcoin Beats.
Today I'm going to show you my Ranges Indicator. Designed initially for breakouts but an analysts mind quickly spots the other uses for this indicator.
If we are consolidating (which is most of the time) a good strategy to trade would be to trade ranges. However, as soon as you spot the range it can feel like the range has changed so you lose out on making the monies.
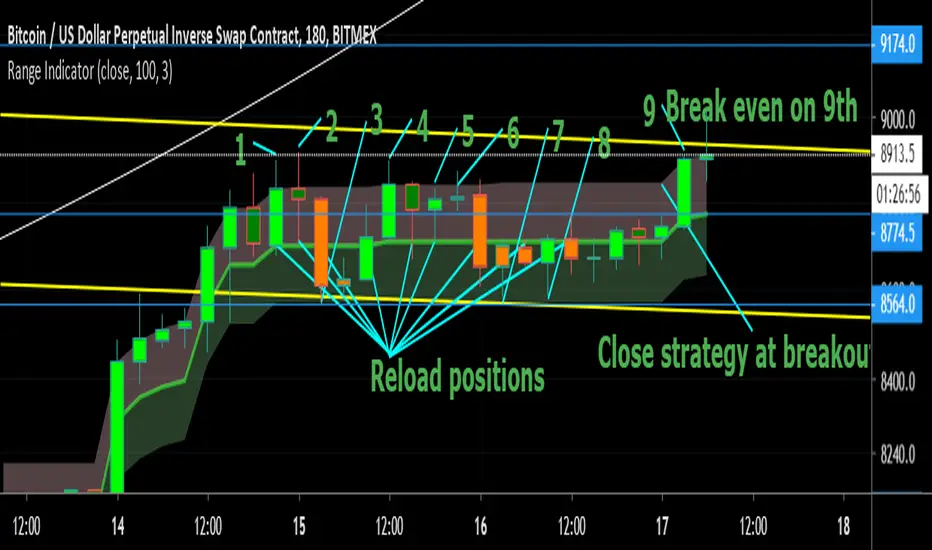
This indicator plots out the average range in a consolidation allowing you to take action and make those monies.
I've highlighted a profitable strategy in the picture that means you can make money on bitcoin when it goes sideways.
Usually if it is appearing volatile, you can go to a higher time frame and find the exact range it's catering to, adjusting your strategy accordingly.
The strategy I've highlighted in accordance with this indicator is longing AND shorting from the center point of a range and cashing out either side until the range breaks.
If you'd like a trial, please leave a comment and I'll add you to the list :)
See you soon,
Goodbye, from Bitcoin Beats.
And welcome back to Bitcoin Beats.
Today I'm going to show you my Ranges Indicator. Designed initially for breakouts but an analysts mind quickly spots the other uses for this indicator.
If we are consolidating (which is most of the time) a good strategy to trade would be to trade ranges. However, as soon as you spot the range it can feel like the range has changed so you lose out on making the monies.
This indicator plots out the average range in a consolidation allowing you to take action and make those monies.
I've highlighted a profitable strategy in the picture that means you can make money on bitcoin when it goes sideways.
Usually if it is appearing volatile, you can go to a higher time frame and find the exact range it's catering to, adjusting your strategy accordingly.
The strategy I've highlighted in accordance with this indicator is longing AND shorting from the center point of a range and cashing out either side until the range breaks.
If you'd like a trial, please leave a comment and I'll add you to the list :)
See you soon,
Goodbye, from Bitcoin Beats.
僅限邀請腳本
只有經作者授權的使用者才能訪問此腳本,且通常需付費。您可以將此腳本加入收藏,但需先向作者申請並獲得許可後才能使用 — 點擊此處了解更多。如需更多詳情,請依照作者說明或直接聯繫Hamilton_Gilpin。
除非您完全信任其作者並了解腳本的工作原理,否則TradingView不建議您付費或使用腳本。您也可以在我們的社群腳本中找到免費的開源替代方案。
作者的說明
提醒:在請求訪問權限之前,請閱讀僅限邀請腳本指南。
免責聲明
這些資訊和出版物並不意味著也不構成TradingView提供或認可的金融、投資、交易或其他類型的意見或建議。請在使用條款閱讀更多資訊。
僅限邀請腳本
只有經作者授權的使用者才能訪問此腳本,且通常需付費。您可以將此腳本加入收藏,但需先向作者申請並獲得許可後才能使用 — 點擊此處了解更多。如需更多詳情,請依照作者說明或直接聯繫Hamilton_Gilpin。
除非您完全信任其作者並了解腳本的工作原理,否則TradingView不建議您付費或使用腳本。您也可以在我們的社群腳本中找到免費的開源替代方案。
作者的說明
提醒:在請求訪問權限之前,請閱讀僅限邀請腳本指南。
免責聲明
這些資訊和出版物並不意味著也不構成TradingView提供或認可的金融、投資、交易或其他類型的意見或建議。請在使用條款閱讀更多資訊。