repo32

Moving Average Colored EMA/SMA

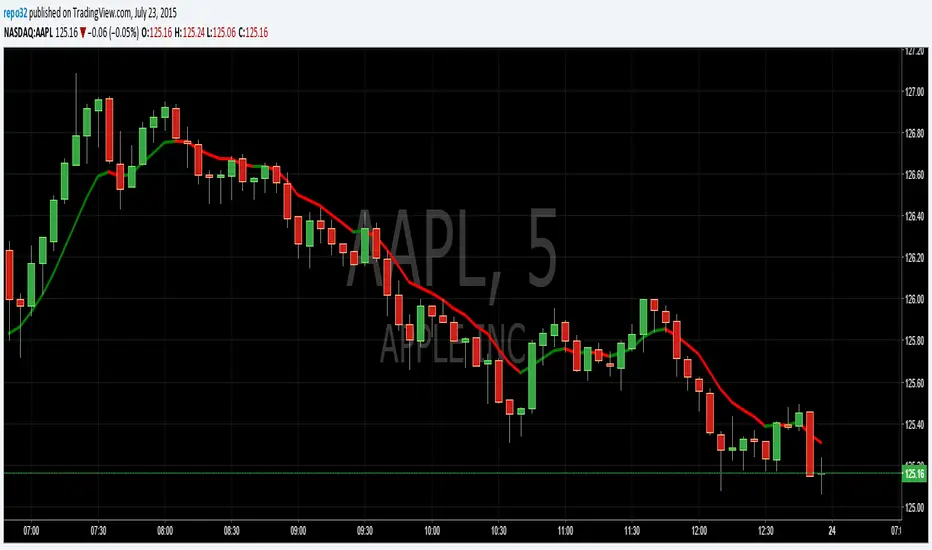
This script will give you the ability to put an EMA and/or SMA on the chart that changes color based upon the direction. Default at startup is EMA visible and SMA hidden. When the MA is moving up, it is green. When the MA is moving down, it is red. You can change the color to whatever you like.
開源腳本

本著真正的TradingView精神,該腳本的作者將其開源發布,以便交易者可以理解和驗證它。為作者喝彩吧!您可以免費使用它,但在出版物中重複使用此代碼受網站規則的約束。 您可以收藏它以在圖表上使用。

免責聲明

這些資訊和出版物並不意味著也不構成TradingView提供或認可的金融、投資、交易或其他類型的意見或建議。請在使用條款閱讀更多資訊。

想在圖表上使用此腳本?
//Created by Robert Nance on 072315
study(title="Moving Average Colored EMA/SMA", shorttitle="Colored EMA /SMA", overlay=true)
emaplot = input (true, title="Show EMA on chart")
len = input(8, minval=1, title="ema Length")
src = close
out = ema(src, len)
up = out > out[1]
down = out < out[1]
mycolor = up ? green : down ? red : blue
plot(out and emaplot ? out :na, title="EMA", color=mycolor, linewidth=3)


smaplot = input (false, title="Show SMA on chart")
len2 = input(8, minval=1, title="sma Length")
src2 = close
out2 = sma(src2, len2)
up2 = out2 > out2[1]
down2 = out2 < out2[1]
mycolor2 = up2 ? green : down2 ? red : blue
plot(out2 and smaplot ? out2 :na , title="SMA", color=mycolor2, linewidth=1)