OPEN-SOURCE SCRIPT
Roof and Floors From Actieve Inversiones
Imagine a Funny and visual way to understand Highest Highs and Lowest Lows. That's the way this indicator was conceived.
The way it Works:
The indicator plots lines in highest highs or lowest lows from a period of "Bars", you only have to set the number of Bars you wanna use and the indicator Makes all the stuff.
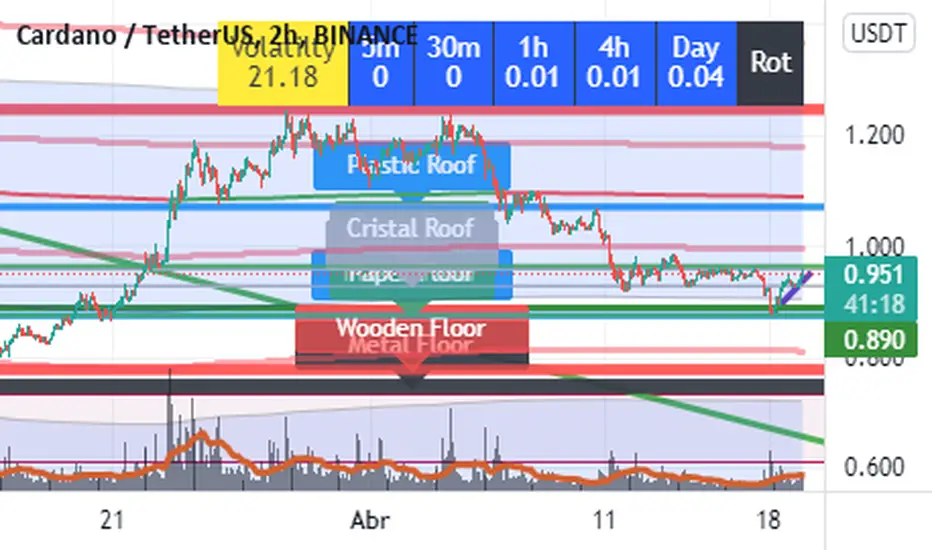
This is a Long term Indicator, so it can Show useful Floors or Roofs from higher Timeframes:
Cristal = Five Min Bars
Paper = thirty Min Bars
Plastic = 1 Hour Bars
Wood = 4 hours Bars
Metal = Daily Bars
But wait... There is something better than that...
If The Floor or Roof Brokes, the indicator will plot a dashed line and a label ¨Broken Roof or Floor¨ u can use it to set a Limit Order or Stop Order, and wait for the pullback.
Do you want some useful Advice ? Check the junctions from Floor or Roofs that are overlayed in some level.
Have Fun and good trading!!!
The way it Works:
The indicator plots lines in highest highs or lowest lows from a period of "Bars", you only have to set the number of Bars you wanna use and the indicator Makes all the stuff.
This is a Long term Indicator, so it can Show useful Floors or Roofs from higher Timeframes:
Cristal = Five Min Bars
Paper = thirty Min Bars
Plastic = 1 Hour Bars
Wood = 4 hours Bars
Metal = Daily Bars
But wait... There is something better than that...
If The Floor or Roof Brokes, the indicator will plot a dashed line and a label ¨Broken Roof or Floor¨ u can use it to set a Limit Order or Stop Order, and wait for the pullback.
Do you want some useful Advice ? Check the junctions from Floor or Roofs that are overlayed in some level.
Have Fun and good trading!!!
開源腳本
秉持TradingView一貫精神,這個腳本的創作者將其設為開源,以便交易者檢視並驗證其功能。向作者致敬!您可以免費使用此腳本,但請注意,重新發佈代碼需遵守我們的社群規範。
免責聲明
這些資訊和出版物並非旨在提供,也不構成TradingView提供或認可的任何形式的財務、投資、交易或其他類型的建議或推薦。請閱讀使用條款以了解更多資訊。
開源腳本
秉持TradingView一貫精神,這個腳本的創作者將其設為開源,以便交易者檢視並驗證其功能。向作者致敬!您可以免費使用此腳本,但請注意,重新發佈代碼需遵守我們的社群規範。
免責聲明
這些資訊和出版物並非旨在提供,也不構成TradingView提供或認可的任何形式的財務、投資、交易或其他類型的建議或推薦。請閱讀使用條款以了解更多資訊。