OPEN-SOURCE SCRIPT
The Next Pivot [Kioseff Trading]
Hello!
This script "The Next Pivot" uses various similarity measures to compare historical price sequences to the current price sequence!
Features

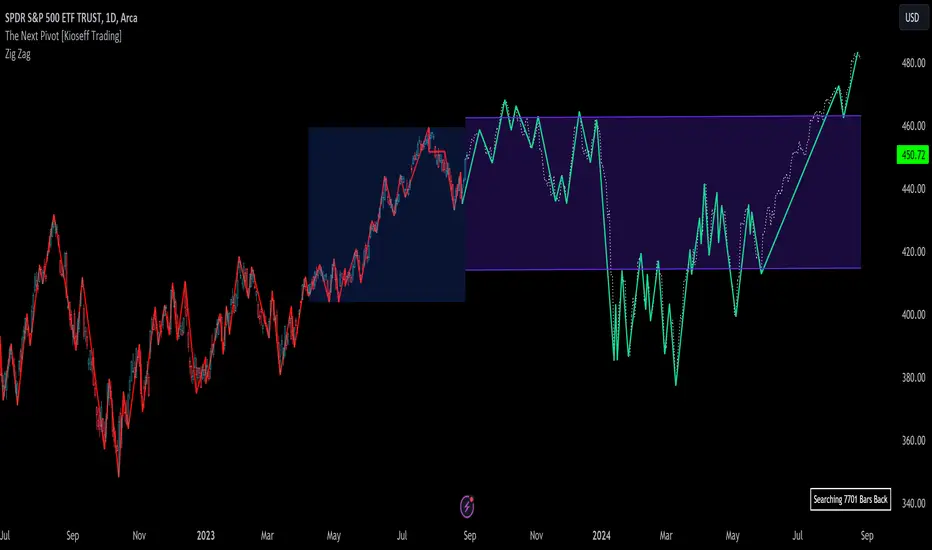
The image above shows/explains some of the indicator's capabilities!

The image above highlights the projected zig zag (pivots) pattern!
Colors are customizable (:

Additionally, you can plot a forecasted LinReg channel.
Should load times permit it, the script can search all bar history for a correlating sequence. This won't always be possible, contingent on the forecast length, correlation length, and the number of bars on the chart.
Reasonable Assessment
The script uses various similarity measures to find the "most similar" price sequence to what's currently happening. Once found, the subsequent price move (to the most similar sequence) is recorded and projected forward.
So,
1: Script finds most similar price sequence
2: Script takes what happened after and projects forward
While this may be useful, the projection is simply the reaction to a possible one-off "similarity" to what's currently happening. Random fluctuations are likely and, if occurring, similarities between the current price sequence and the "most similar" sequence are plausibly coincidental.
That said, if you have any ideas on cool features to add please let me know!
Thank you (:
This script "The Next Pivot" uses various similarity measures to compare historical price sequences to the current price sequence!
Features
- Find the most similar price sequence up to 100 bars from the current bar
- Forecast price path up to 250 bars
- Forecast ZigZag up to 250 bars
- Spearmen
- Pearson
- Absolute Difference
- Cosine Similarity
- Mean Squared Error
- Kendall
- Forecasted linear regression channel
The image above shows/explains some of the indicator's capabilities!
The image above highlights the projected zig zag (pivots) pattern!
Colors are customizable (:
Additionally, you can plot a forecasted LinReg channel.
Should load times permit it, the script can search all bar history for a correlating sequence. This won't always be possible, contingent on the forecast length, correlation length, and the number of bars on the chart.
Reasonable Assessment
The script uses various similarity measures to find the "most similar" price sequence to what's currently happening. Once found, the subsequent price move (to the most similar sequence) is recorded and projected forward.
So,
1: Script finds most similar price sequence
2: Script takes what happened after and projects forward
While this may be useful, the projection is simply the reaction to a possible one-off "similarity" to what's currently happening. Random fluctuations are likely and, if occurring, similarities between the current price sequence and the "most similar" sequence are plausibly coincidental.
That said, if you have any ideas on cool features to add please let me know!
Thank you (:
開源腳本
本著TradingView的真正精神,此腳本的創建者將其開源,以便交易者可以查看和驗證其功能。向作者致敬!雖然您可以免費使用它,但請記住,重新發佈程式碼必須遵守我們的網站規則。
•Access to Next-Gen Optimization Tools: tradingiq.io
•Discord Server: discord.gg/aKWPuM4HPy
•Discord Server: discord.gg/aKWPuM4HPy
免責聲明
這些資訊和出版物並不意味著也不構成TradingView提供或認可的金融、投資、交易或其他類型的意見或建議。請在使用條款閱讀更多資訊。
開源腳本
本著TradingView的真正精神,此腳本的創建者將其開源,以便交易者可以查看和驗證其功能。向作者致敬!雖然您可以免費使用它,但請記住,重新發佈程式碼必須遵守我們的網站規則。
•Access to Next-Gen Optimization Tools: tradingiq.io
•Discord Server: discord.gg/aKWPuM4HPy
•Discord Server: discord.gg/aKWPuM4HPy
免責聲明
這些資訊和出版物並不意味著也不構成TradingView提供或認可的金融、投資、交易或其他類型的意見或建議。請在使用條款閱讀更多資訊。