OPEN-SOURCE SCRIPT
已更新 29&71 Goldbach levels
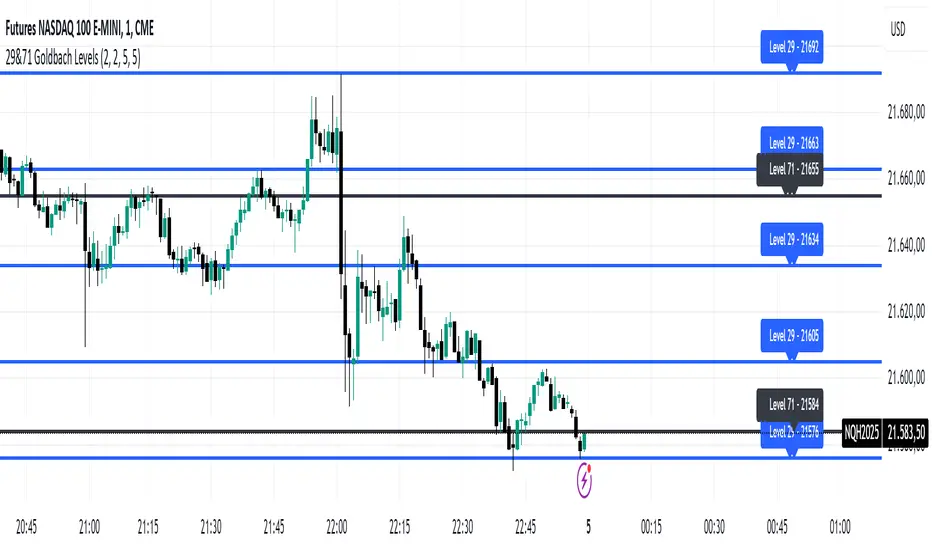
The indicator automatically plots horizontal lines at the 29 and 71 price levels on your chart. These levels serve as psychological barriers in the market, where price action may react or consolidate, just as prime numbers are fundamental in the theory of numbers.
---
Features:
- 29 Level: Identifies significant areas where market participants may encounter support or resistance, similar to the importance of prime numbers in Goldbach's conjecture.
- 71 Level: Marks another key zone that might indicate possible price breakouts or reversals, offering traders a reference point for decision-making.
- Customizable: You can adjust the colors, line styles, or alerts associated with these levels to fit your trading preferences.
How to Use:
- Use the 29 and 71 levels to spot potential areas of support or resistance on the chart.
- Watch for price reactions at these levels for possible breakout or reversal setups.
- Combine the levels with other technical indicators for added confirmation.
---
This indicator blends the theory of prime numbers with market analysis, offering traders a novel approach to identifying key levels that might influence price movements.
---
Features:
- 29 Level: Identifies significant areas where market participants may encounter support or resistance, similar to the importance of prime numbers in Goldbach's conjecture.
- 71 Level: Marks another key zone that might indicate possible price breakouts or reversals, offering traders a reference point for decision-making.
- Customizable: You can adjust the colors, line styles, or alerts associated with these levels to fit your trading preferences.
How to Use:
- Use the 29 and 71 levels to spot potential areas of support or resistance on the chart.
- Watch for price reactions at these levels for possible breakout or reversal setups.
- Combine the levels with other technical indicators for added confirmation.
---
This indicator blends the theory of prime numbers with market analysis, offering traders a novel approach to identifying key levels that might influence price movements.
發行說明
The indicator automatically plots horizontal lines at the 29 and 71 price levels on your chart. These levels serve as psychological barriers in the market, where price action may react or consolidate, just as prime numbers are fundamental in the theory of numbers.---
Features:
- 29 Level: Identifies significant areas where market participants may encounter support or resistance, similar to the importance of prime numbers in Goldbach's conjecture.
- 71 Level: Marks another key zone that might indicate possible price breakouts or reversals, offering traders a reference point for decision-making.
- Customizable: You can adjust the colors, line styles, or alerts associated with these levels to fit your trading preferences.
How to Use:
- Use the 29 and 71 levels to spot potential areas of support or resistance on the chart.
- Watch for price reactions at these levels for possible breakout or reversal setups.
- Combine the levels with other technical indicators for added confirmation.
---
This indicator blends the theory of prime numbers with market analysis, offering traders a novel approach to identifying key levels that might influence price movements.
發行說明
New version plotting by default 71 lev midpoints發行說明
New version with Midpoints for 29 and 71 levels發行說明
New version - small bugs solved開源腳本
秉持TradingView一貫精神,這個腳本的創作者將其設為開源,以便交易者檢視並驗證其功能。向作者致敬!您可以免費使用此腳本,但請注意,重新發佈代碼需遵守我們的社群規範。
免責聲明
這些資訊和出版物並非旨在提供,也不構成TradingView提供或認可的任何形式的財務、投資、交易或其他類型的建議或推薦。請閱讀使用條款以了解更多資訊。
免責聲明
這些資訊和出版物並非旨在提供,也不構成TradingView提供或認可的任何形式的財務、投資、交易或其他類型的建議或推薦。請閱讀使用條款以了解更多資訊。