OPEN-SOURCE SCRIPT
تلوين الشموع حسب الحجم (يومي أو متوسط)
📊 Indicator Name:
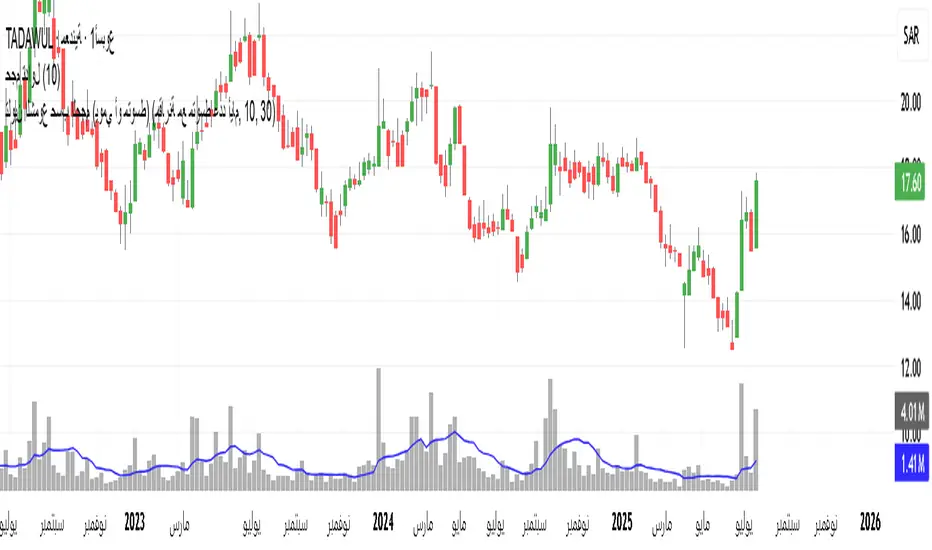
Candle Coloring Based on Volume Change (Flexible Comparison)
🎯 Purpose of the Indicator:
This indicator colors candlesticks based solely on changes in volume, regardless of price direction. It helps traders visualize unusual volume activity and potential accumulation or distribution zones.
It also displays the percentage change in volume above each candle — based on a comparison method chosen by the user.
⚙️ User Inputs:
Comparison Method (Mode):
"Compare with Previous Day":
The volume of the current candle is compared with the volume of the previous candle.
"Compare with Average of N Days":
The volume is compared with a moving average of volume over a number of past days (e.g., 10 days).
Average Length (for mode 2):
Used only when "Compare with Average" is selected.
Defines the number of days over which to calculate the volume average.
Minimum % Change to Show Label:
A threshold that controls when the percentage label appears.
Prevents label clutter for insignificant volume changes.
🎨 Candle Coloring Logic:
Condition Meaning Candle Color
Current volume > reference volume High activity 🟢 Green
Current volume < reference volume Low activity 🔴 Red
Nearly equal volumes Normal ⚪ Gray
🏷️ Volume Change Label:
The indicator displays a percentage change label above the candle.
For example:
If volume increased by 45% → label shows +45.00%.
If the change exceeds ±50%, the label turns yellow to indicate a significant spike.
✅ Key Benefits:
Quickly detects unusual volume activity (e.g., spikes, drops).
Enhances classic price-action analysis with volume context.
Flexible comparison:
Day-to-day for short-term traders.
Moving average for swing and position traders.
Clean, minimalist design with conditional labels.
🔍 Use Case Examples:
🔴 Red candle on price rise → weak rally (low participation).
🟢 Green candle on price drop → potential distribution.
⚪ Gray candles → sideways or stable behavior.
👤 Who Should Use It?
Day traders and scalpers monitoring volume strength.
Technical analysts who focus on volume-price behavior.
Traders who track accumulation/distribution patterns.
開源腳本
秉持TradingView一貫精神,這個腳本的創作者將其設為開源,以便交易者檢視並驗證其功能。向作者致敬!您可以免費使用此腳本,但請注意,重新發佈代碼需遵守我們的社群規範。
محمد الشمري
免責聲明
這些資訊和出版物並非旨在提供,也不構成TradingView提供或認可的任何形式的財務、投資、交易或其他類型的建議或推薦。請閱讀使用條款以了解更多資訊。
開源腳本
秉持TradingView一貫精神,這個腳本的創作者將其設為開源,以便交易者檢視並驗證其功能。向作者致敬!您可以免費使用此腳本,但請注意,重新發佈代碼需遵守我們的社群規範。
محمد الشمري
免責聲明
這些資訊和出版物並非旨在提供,也不構成TradingView提供或認可的任何形式的財務、投資、交易或其他類型的建議或推薦。請閱讀使用條款以了解更多資訊。