OPEN-SOURCE SCRIPT
已更新 ADX+ Oscillator
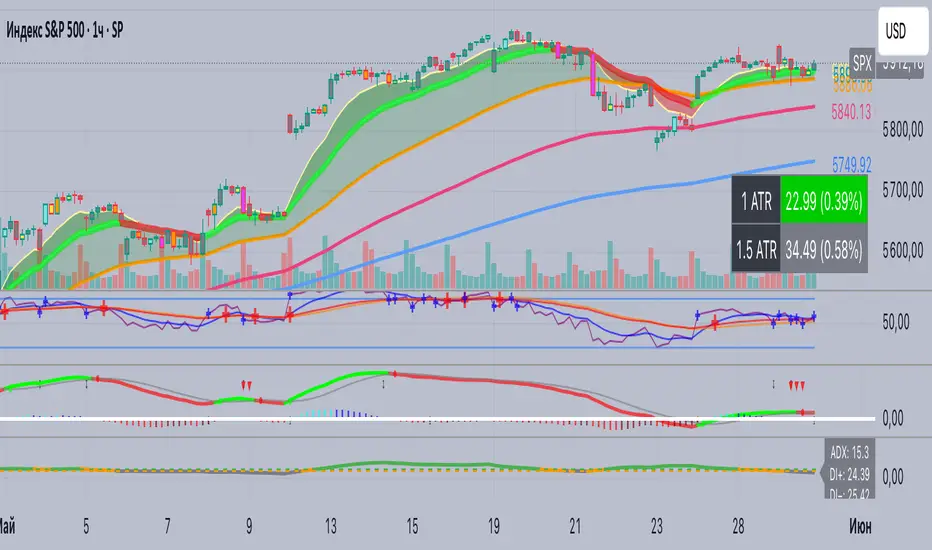
📈 ADX+ Oscillator — Enhanced Trend Strength Indicator
🔹 Description:
A modified oscillator based on the ADX (Average Directional Index), providing both visual and digital interpretation of trend strength and direction. A powerful tool for filtering sideways markets and identifying strong impulses across any timeframe.
🔹 Features:
• ADX line to assess trend strength
• DI+ and DI− lines to determine trend direction
• Colored background zones:
• Gray: ranging market (ADX < 20)
• Orange: transition zone (20 ≤ ADX < 25)
• Green: strong trend (ADX ≥ 25)
• Digital value labels for ADX / DI+ / DI− on the latest candle
• Signal arrows when DI+ crosses DI− and vice versa
🔹 Why use it:
• Signal filtering: avoid trades in flat markets (ADX < 20)
• Trend confirmation: enter only when ADX is rising above 25
• Directional guidance via DI+ and DI− behavior
🔹 Best for:
• Scalping (1m, 5m)
• Intraday trading (15m, 1h)
• Swing trading (4h and above)
• Breakout and pullback strategies
發行說明
📈 ADX+ Oscillator — Enhanced Trend Strength Indicator🔹 Description:
A modified oscillator based on the ADX (Average Directional Index), providing both visual and digital interpretation of trend strength and direction. A powerful tool for filtering sideways markets and identifying strong impulses across any timeframe.
🔹 Features:
• ADX line to assess trend strength
• DI+ and DI− lines to determine trend direction
• Colored background zones:
• Gray: ranging market (ADX < 20)
• Orange: transition zone (20 ≤ ADX < 25)
• Green: strong trend (ADX ≥ 25)
• Digital value labels for ADX / DI+ / DI− on the latest candle
• Signal arrows when DI+ crosses DI− and vice versa
🔹 Why use it:
• Signal filtering: avoid trades in flat markets (ADX < 20)
• Trend confirmation: enter only when ADX is rising above 25
• Directional guidance via DI+ and DI− behavior
🔹 Best for:
• Scalping (1m, 5m)
• Intraday trading (15m, 1h)
• Swing trading (4h and above)
• Breakout and pullback strategies
開源腳本
秉持TradingView一貫精神,這個腳本的創作者將其設為開源,以便交易者檢視並驗證其功能。向作者致敬!您可以免費使用此腳本,但請注意,重新發佈代碼需遵守我們的社群規範。
免責聲明
這些資訊和出版物並非旨在提供,也不構成TradingView提供或認可的任何形式的財務、投資、交易或其他類型的建議或推薦。請閱讀使用條款以了解更多資訊。
開源腳本
秉持TradingView一貫精神,這個腳本的創作者將其設為開源,以便交易者檢視並驗證其功能。向作者致敬!您可以免費使用此腳本,但請注意,重新發佈代碼需遵守我們的社群規範。
免責聲明
這些資訊和出版物並非旨在提供,也不構成TradingView提供或認可的任何形式的財務、投資、交易或其他類型的建議或推薦。請閱讀使用條款以了解更多資訊。