PROTECTED SOURCE SCRIPT
[DEM] Sequential Identifying Table
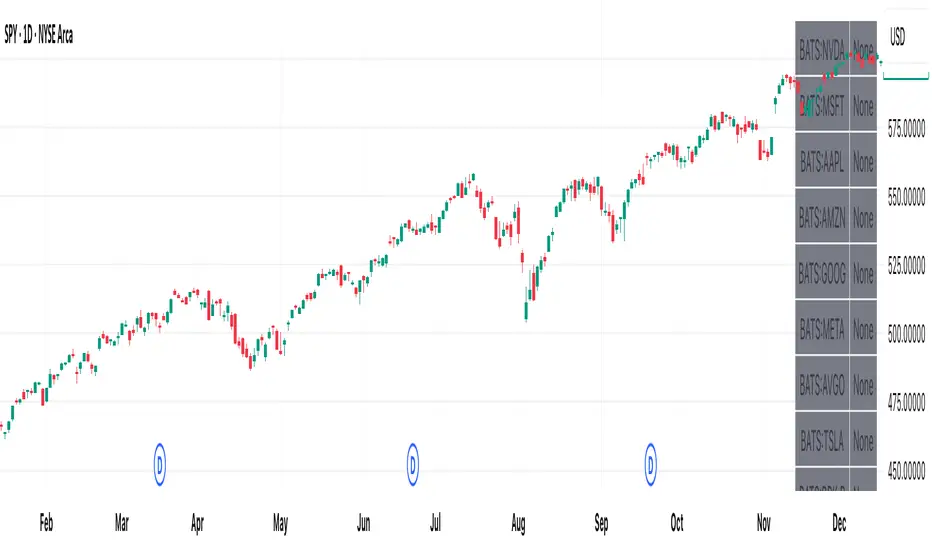
[DEM] Sequential Identifying Table is designed to monitor Sequential methodology across up to 20 customizable symbols simultaneously, displaying buy and sell signals in a comprehensive dashboard format overlaid on the price chart. The indicator implements a sequential counting system, which tracks consecutive closes above or below the close from four periods ago, generating buy signals when a downward sequence reaches 8 (indicating potential exhaustion and reversal upward) and sell signals when an upward sequence reaches 8 (indicating potential exhaustion and reversal downward). The table displays each symbol with color-coded backgrounds (green for buy signals, red for sell signals, gray for no signal) and corresponding signal text, operating on a selectable timeframe from 1-minute to monthly intervals, allowing traders to quickly scan multiple assets for sequential setups without switching between different charts or timeframes.
受保護腳本
此腳本以閉源形式發佈。 不過,您可以自由且不受任何限制地使用它 — 在此處了解更多資訊。
免責聲明
這些資訊和出版物並不意味著也不構成TradingView提供或認可的金融、投資、交易或其他類型的意見或建議。請在使用條款閱讀更多資訊。
受保護腳本
此腳本以閉源形式發佈。 不過,您可以自由且不受任何限制地使用它 — 在此處了解更多資訊。
免責聲明
這些資訊和出版物並不意味著也不構成TradingView提供或認可的金融、投資、交易或其他類型的意見或建議。請在使用條款閱讀更多資訊。