OPEN-SOURCE SCRIPT
已更新 RS Rating
Hello everyone.
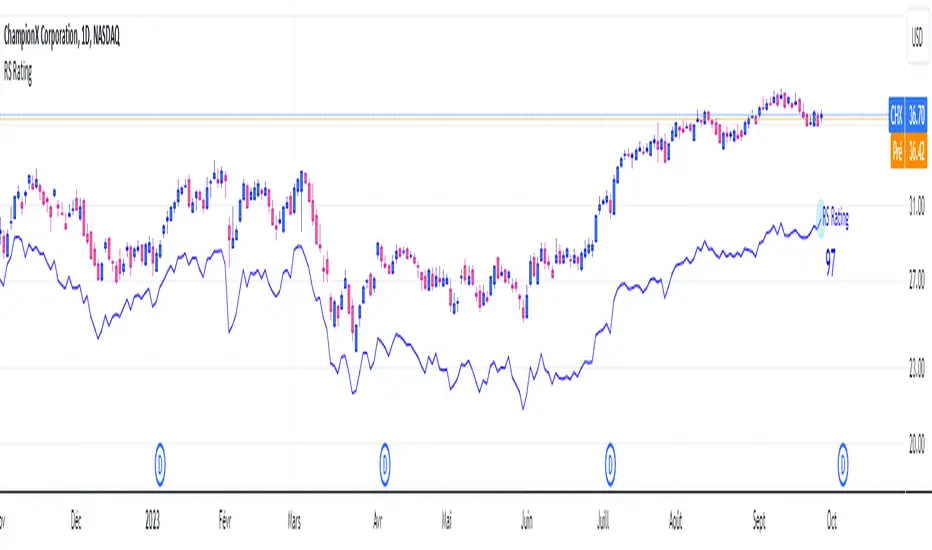
The RS Rating (or Relative Strenght Rating) is a metric that tracks a stock's price performance relative to the rest of the market. Specifically, it looks at a stock's relative strength over the last 52 weeks.
It allows you to identify at a glance stocks that are outperforming the market and may be poised for further gains.
Designed for break-out traders, trend follower, value investors, the RS Rating can help you identify promising opportunities and make informed investment decisions.
The Rating stands as follow:
- From 1 (worst) to 99 (best)
- 99 rating means the stock is outperforming 99% of all stocks in terms of relative share price performance over the last 52 weeks.
The RS Rating is accompanied by the RS line which is a representation of the progress of the asset against the comparative symbol. (Here SP500)
Of course this script is inspired by the IBD rating system.
The results may be equivalent but it is not guaranteed.
This indicator proposes a scoring system in the style of the one proposed by IBD.
Indeed for an optimal result, it would be necessary to compare the relative performance of all actions, which is not yet possible on PineScript.
Here is the formula for calculating the score:
RS Score = 40% * P3 + 20% * P6 + 20% * P9 + 20% * P12
With
P3 = Performance over the last 3 months
P6 = Performance over the last 6 months
P9 = Performance over the last 9 months
P12 = Performance over the last 12 months
There is no equivalent solution for the moment on TradingView.
The rating score will only appear on the daily timeframe.
For now it's my pleasure to share!
發行說明
- Now the color is the same than IBD's RS Rating and Line發行說明
- Corrected a bug that was causing the labels to be displayed several times in case a new candle opened or in replay mode發行說明
- The input of the comparative ticker is now taken into account for the RS Rating calculation發行說明
- Now display a result different than NaN for IPO stocks發行說明
Added the blue dot function, now a blue dot can appear on the line if:- RS at New Highs
- RS at New Highs Before Price
- Historical RS at New Highs
- Historical RS at New Highs Before Price
發行說明
- Improved display speed by adding "max_bars_back = 253" the script was counting all the bars of the graph while it was not necessary To benefit from the new version, remove the script, refresh your chart and add it back :)
發行說明
- Adjusted display offset發行說明
- Modified SPX Value input- Modified offset display
- Added a limitation for the 3rd method of calculaton of the RS Rating
- Now low score should be more accurate
發行說明
- Replaced the "value of the comparative ticker" to enter by an offset system. It does the same thing but will generate less questions. The previous offset system was not that clear 發行說明
- Removed the part with float variable to handle New High and New High Before Price- Added Optional New Low dots
- Added Optional 21 EMA on everytime frame except in Weekly Timeframe with 10 SMA, on the RS Line
- Possible to color the area between the MA and the RS Line
- Arranged inputs
發行說明
- Updated the max value of the offset to be 2000 instead of 300, this way you can display correctly with the NIFTY as a reference with for example an offset of 320發行說明
- Simplified the code regarding Ma on RS Line- Added Historical New Highs/Lows as a default value
發行說明
I'm delighted to announce a major update to the RS Rating indicator, which should bring you a much more effective scoring system. My studies (based on a short sample) show an average deviation of +/- 3 to 5 points for the TradingView indicator and +/- 4 points for the GitHub project, compared with the IBD/MarketSmith RS Rating.
The biggest deltas are in the 30-60 range.
The new flagship feature of this update is TradingView's introduction of the 'request.seed()' function!
My warmest thanks to TradingView for giving me the opportunity and the tools to share this script.
Thanks to this function, it has been possible to offer a dynamic environment that simulates the relative performance of some 6,600 stocks on the US market.
The GitHub-managed part is publicly accessible via 'github.com/Fred6725/relative-strength'
More precisly in 'rs_ranking.py' for extracting the needed data and in workflows/output.yml for the auto update.
You can also use the daily updated 'rs_stocks.csv' of GitHub to quickly access the RS Ratings via Google Sheets!
I sincerely hope you will appreciate the time and effort I've put into making these improvements!
This solution is only available for the US market.
發行說明
- Modified Graph presentation發行說明
- Modified the display in replay mode from 'RS Rating -1' to 'RS'.發行說明
- Changed default value of RS New High-Low to 252 bars and 52 We when the default value of 252 is set.If you change the value for example to 40, this will be 40 Day in Daily, 40 We in Weekly etc.
- Corrected pilling on labels for non-historical New High-Low.
- Changes default value of New High-Low label size
- Added an input to modify New High-Low label value
發行說明
- Modified labels to tiny發行說明
- Changes lookback default value to 250 as it seems that this is the default value of MarketSmith發行說明
- Adapted the offset display for Sectors and Indices發行說明
- Adjusted Label Position發行說明
- Added Default Blue Dot New High發行說明
- Now we can display the rating only, eg: for smartphone display發行說明
- In this update, I propose to use an option to view the historical RS Rating. This method is an approximation, as the performance environment of US equities varies over time, whereas the historical RS Rating is calculated with fixed values. However, this option can be of interest when studying past setups, and can provide relevant indications.Thank you Otteri, I had the idea thanks to you!
發行說明
- We can now add a second SMA/EMA on the RS Line.- We can now modify the Line Curve by the ticker of our choice.
(I choosed to put back this option despite the high number of questions it generated because of the value of the comparative symbole to enter in order to calculate the cross product.)
開源腳本
本著TradingView的真正精神,此腳本的創建者將其開源,以便交易者可以查看和驗證其功能。向作者致敬!雖然您可以免費使用它,但請記住,重新發佈程式碼必須遵守我們的網站規則。
免責聲明
這些資訊和出版物並不意味著也不構成TradingView提供或認可的金融、投資、交易或其他類型的意見或建議。請在使用條款閱讀更多資訊。
開源腳本
本著TradingView的真正精神,此腳本的創建者將其開源,以便交易者可以查看和驗證其功能。向作者致敬!雖然您可以免費使用它,但請記住,重新發佈程式碼必須遵守我們的網站規則。
免責聲明
這些資訊和出版物並不意味著也不構成TradingView提供或認可的金融、投資、交易或其他類型的意見或建議。請在使用條款閱讀更多資訊。