OPEN-SOURCE SCRIPT
Reductionism candle chart
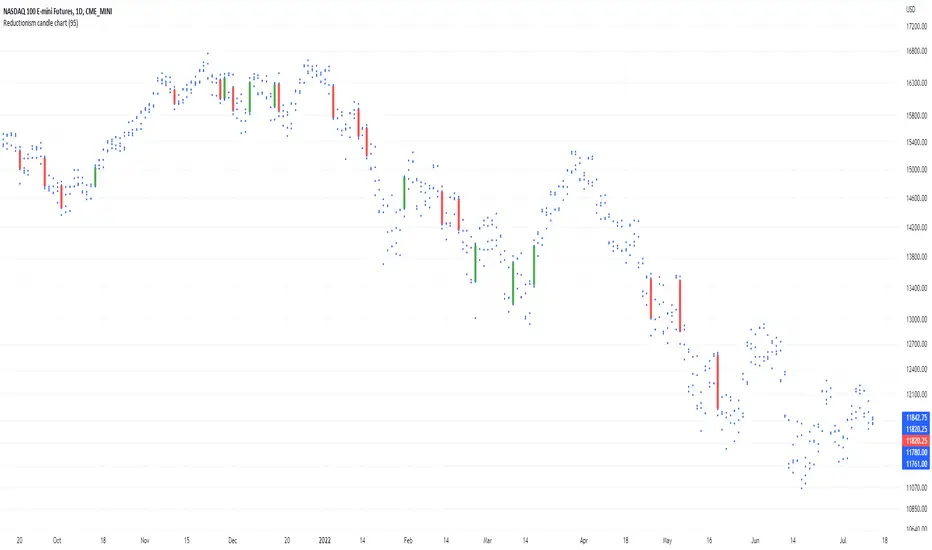
Here I am introducing "Reductionism candle chart", in most of the case takeing away those distracting "candles", and also remaining the most of data (4 dots) for each index on the chart.
And only keeping high valuation change "price gap" filled up with candles.
For someone who don't relies on candles to their decision. Usually candles are redundant to them.
For someone who uses candle, definitely not all candles are carrying the same amount of information.
Most often less is more, in terms of representing the thing that is not related to your model.
This script the color and the volatility boundary are changeable, so no additional coding is required to use it.
Enjoy :)
開源腳本
秉持TradingView一貫精神,這個腳本的創作者將其設為開源,以便交易者檢視並驗證其功能。向作者致敬!您可以免費使用此腳本,但請注意,重新發佈代碼需遵守我們的社群規範。
免責聲明
這些資訊和出版物並非旨在提供,也不構成TradingView提供或認可的任何形式的財務、投資、交易或其他類型的建議或推薦。請閱讀使用條款以了解更多資訊。
開源腳本
秉持TradingView一貫精神,這個腳本的創作者將其設為開源,以便交易者檢視並驗證其功能。向作者致敬!您可以免費使用此腳本,但請注意,重新發佈代碼需遵守我們的社群規範。
免責聲明
這些資訊和出版物並非旨在提供,也不構成TradingView提供或認可的任何形式的財務、投資、交易或其他類型的建議或推薦。請閱讀使用條款以了解更多資訊。