OPEN-SOURCE SCRIPT
已更新 Call and Put by Powerful Trading
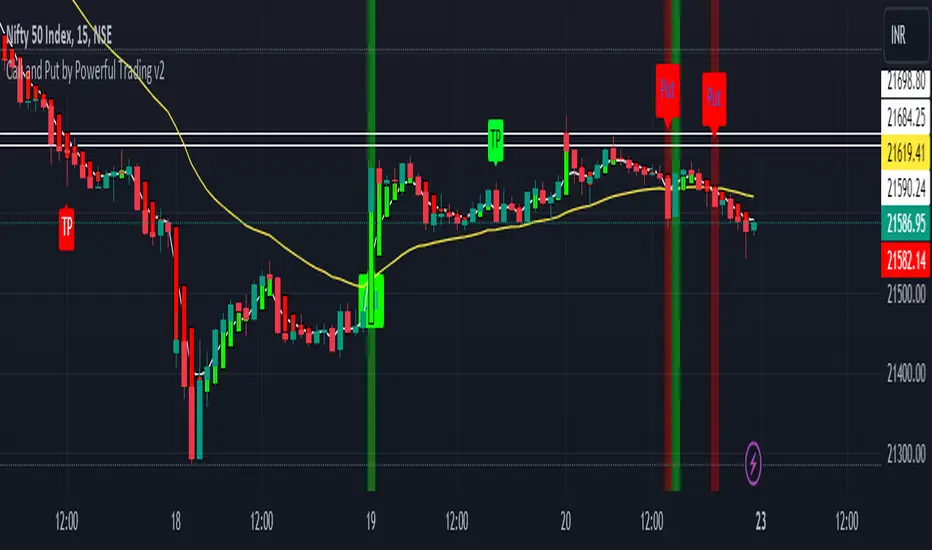
This script attempts to use Exponential Moving averages (short-term and long-term convergence) of different lengths in order to identify trade entries and exits for bullish & bearish trades. I would strongly recommend using it on Bank nifty , Nifty 50 .https://www.tradingview.com/x/P71QZJEd/ You use this script by entering a trade when it signals a green CALL signal with a UP label and exiting when it signals red put signal. The general idea is that one is fast and one is slow-moving EMA and these indicate when to buy/sell when they crossover the overbought/sold lines.
It also provides a vertical line with green and red color , when short ema is over it shows green vertical line and when short ema is below it provides red vertical line.
Best for bank nifty on 15 mins chart
It also provides a vertical line with green and red color , when short ema is over it shows green vertical line and when short ema is below it provides red vertical line.
Best for bank nifty on 15 mins chart
發行說明
If you don't understand when to exit we have added crosses on chart.Plus now you can identify the trends with the help of Heikin ashi candle shown with the normal chart.
Also wrong signals given have been fixed.
Now it seems best to trade on any charts and anytime frame
Suggested time frame 2 hours char and 15 mins chart
Works best with banknifty , forex and btcusd now.
發行說明
New update -Alerts added
Best settings already given for 15 mins
Now settings can be taken till 1
Take profit added with SMI calculations.
To use this updated chart , remove and re add the indicator.
開源腳本
秉持TradingView一貫精神,這個腳本的創作者將其設為開源,以便交易者檢視並驗證其功能。向作者致敬!您可以免費使用此腳本,但請注意,重新發佈代碼需遵守我們的社群規範。
免責聲明
這些資訊和出版物並非旨在提供,也不構成TradingView提供或認可的任何形式的財務、投資、交易或其他類型的建議或推薦。請閱讀使用條款以了解更多資訊。
開源腳本
秉持TradingView一貫精神,這個腳本的創作者將其設為開源,以便交易者檢視並驗證其功能。向作者致敬!您可以免費使用此腳本,但請注意,重新發佈代碼需遵守我們的社群規範。
免責聲明
這些資訊和出版物並非旨在提供,也不構成TradingView提供或認可的任何形式的財務、投資、交易或其他類型的建議或推薦。請閱讀使用條款以了解更多資訊。