OPEN-SOURCE SCRIPT
Volume Index (0-100)
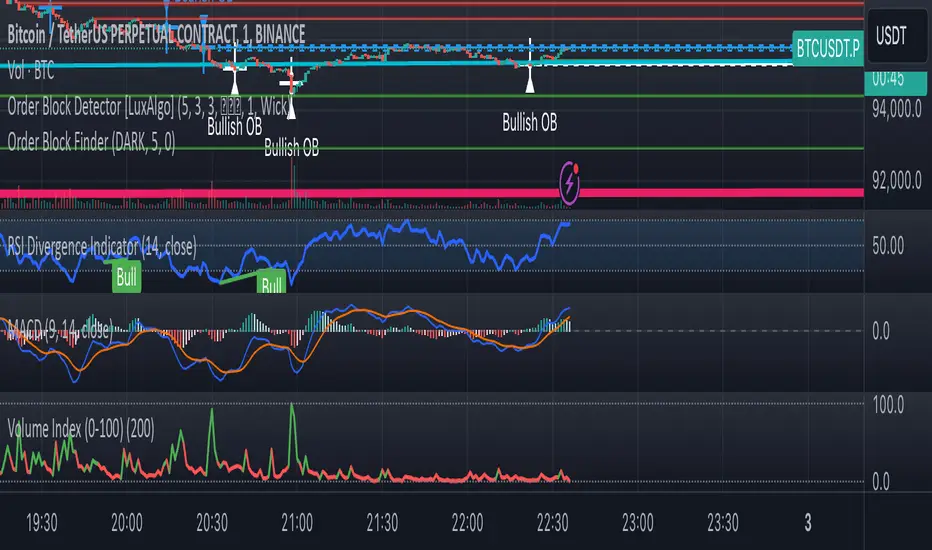
Volume Index (0-100) Indicator
The Volume Index (0-100) indicator is a powerful tool designed to help traders understand current volume levels in relation to past activity over a specified period. By normalizing volume data to a scale from 0 to 100, this indicator makes it easy to compare today's volume against recent history and gauge the strength of market movements.
Key Features:
Normalized Volume Index: The indicator indexes volume between 0 and 100, allowing traders to easily determine if the current volume is unusually high or low compared to recent trends.
Colored Visualization: The line graph is colored green for positive volume (increasing activity) and red for negative volume (decreasing activity). This helps traders quickly grasp the market sentiment and volume direction.
User-Defined Lookback Period: Traders can customize the lookback period to best fit their trading strategy, providing flexibility for different market conditions.
How Traders Can Use It:
Identifying Volume Extremes: The Volume Index helps identify periods of unusually high or low volume. Values approaching 100 indicate high volume, while values close to 0 indicate low volume.
Confirmation Tool: During price movements, high volume (near 100) can act as a confirmation signal for the strength of the trend. For instance, a high volume during an uptrend may indicate strong buying interest.
Divergence Analysis: Traders can look for divergences between volume and price. For example, if the price is consolidating while the Volume Index remains high, it could signal an impending breakout.
Volume Alerts: The indicator includes an alert feature when the Volume Index exceeds 80, helping traders stay informed about potential shifts in market volatility.
開源腳本
秉持TradingView一貫精神,這個腳本的創作者將其設為開源,以便交易者檢視並驗證其功能。向作者致敬!您可以免費使用此腳本,但請注意,重新發佈代碼需遵守我們的社群規範。
免責聲明
這些資訊和出版物並非旨在提供,也不構成TradingView提供或認可的任何形式的財務、投資、交易或其他類型的建議或推薦。請閱讀使用條款以了解更多資訊。
免責聲明
這些資訊和出版物並非旨在提供,也不構成TradingView提供或認可的任何形式的財務、投資、交易或其他類型的建議或推薦。請閱讀使用條款以了解更多資訊。