OPEN-SOURCE SCRIPT
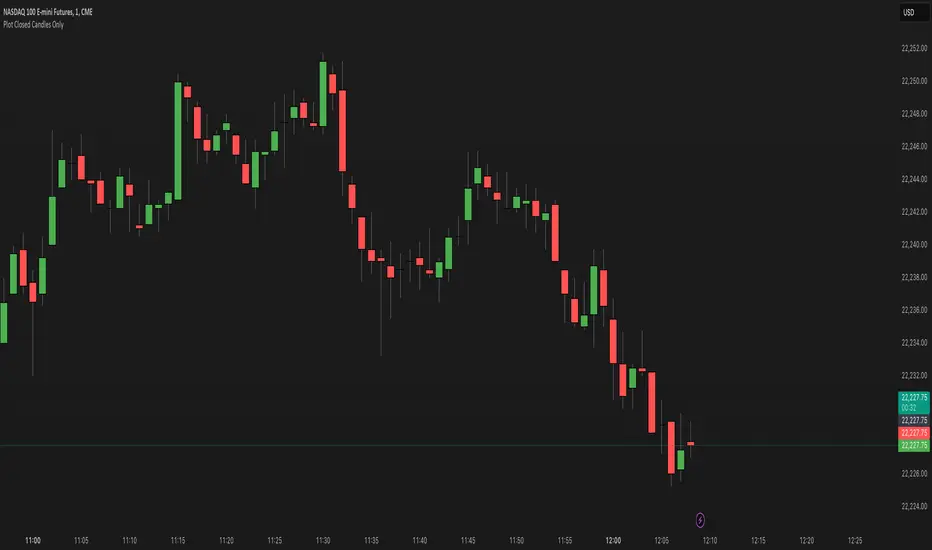
Plot Closed Candles Only
What It Does:
This indicator helps you see candlesticks on your chart only after they are fully closed. It colors the candles based on whether they are bullish (green), bearish (red), or neutral (black/Doji). This way, you can focus on confirmed price movements without the distraction of candles that are still forming.
Key Features:
How to Use:
Why Use It?:
This indicator helps you see candlesticks on your chart only after they are fully closed. It colors the candles based on whether they are bullish (green), bearish (red), or neutral (black/Doji). This way, you can focus on confirmed price movements without the distraction of candles that are still forming.
Key Features:
- Plots Confirmed Candles: Only shows candles after they are fully formed.
Custom Colors: - Green: Bullish candles (close > open).
- Red: Bearish candles (close < open).
- Black: Doji candles (close = open).
- Easy to Use: Simply add the indicator to your chart.
How to Use:
- Add the indicator to your chart.
- Turn off the default candles by:
- Right-clicking on the chart.
- Going to Style > Candles.
- Disabling borders, bodies, and wicks for the default candles.
- Enjoy a cleaner view of confirmed candles with clear color coding!
Why Use It?:
- Helps you focus on confirmed price action.
- Makes it easier to spot bullish, bearish, and neutral candles.
- Great for traders who want to avoid the noise of incomplete candles.
開源腳本
秉持TradingView一貫精神,這個腳本的創作者將其設為開源,以便交易者檢視並驗證其功能。向作者致敬!您可以免費使用此腳本,但請注意,重新發佈代碼需遵守我們的社群規範。
免責聲明
這些資訊和出版物並非旨在提供,也不構成TradingView提供或認可的任何形式的財務、投資、交易或其他類型的建議或推薦。請閱讀使用條款以了解更多資訊。
開源腳本
秉持TradingView一貫精神,這個腳本的創作者將其設為開源,以便交易者檢視並驗證其功能。向作者致敬!您可以免費使用此腳本,但請注意,重新發佈代碼需遵守我們的社群規範。
免責聲明
這些資訊和出版物並非旨在提供,也不構成TradingView提供或認可的任何形式的財務、投資、交易或其他類型的建議或推薦。請閱讀使用條款以了解更多資訊。